- Why Us?
- Features
White Label
For SaaS Platforms & Agencies
Provide our complete analytics suite to your clients, directly within your own interface and with your/their own branding. Discover Analytics-as-a-Service and White Label Analytics. Great benefit, minimal effort.
- Pricing
- White Label
- Success Stories
- Partner
- ResourcesExpand Your Knowledge
- First Steps Checklist
-
Frequently Asked Questions
-
All About Features
- How to Install the Tracking Code
-
User Guides
-
Integrating With Other Platforms
-
Legal, Data Privacy & Certificates
- TWAIA Addendum
- White Label Analytics
- Glossary
- Contact
Event Tracking
Detect Any Action or Event Taking Place on Your Website!
Event Tracking captures visitor interactions on your website, from automatically tracked standard events to manually-defined custom events. Use this feature to monitor precisely how often visitors trigger specific actions over time.
Important Note: Due to Wix platform restrictions on accessing and modifying specific element code, it is not possible to create or capture custom event tags. Automatic capture of standard events remains fully functional and ensures that all standard events are captured correctly.
Right above the tiles, you can see a date picker. This enables you to select a certain time period, or specific day, for which you want the Dashboard's data to correspond.
It is crucial to limit the presentation of data to specific dates or timeframes during which you executed potential campaigns or implemented other strategies. This will allow you to assess the effectiveness of these actions and use the insights gained for future planning.
Important Note: The app now remembers previously set segments, filters, filter templates, and date intervals, even when you navigate away from the page, log out, or log back in. When your session expires or you close the tab, it automatically switches back to the default setting of "Last 30 Days."
- Make sure you have updated your app and tracking code with the latest version (replace the current tracking code with the fresh one recently released), so you can benefit from this feature.
- The limit for the events included is on a monthly basis. Resetting your data will not reset the counter of the fired events. It will start tracking again next month, or from the moment an upgrade takes place and the limit is lifted.
- Some alarming behavior events are generated using session recordings other result from visits data. The functionality does NOT consume any events budget.
- A lot of elements contain descriptions if you hover over them. Just let your cursor run over various elements and discover how much data is actually packed into a tile.
- Tooltips now display the abbreviated day of the week wherever dates are available. This will help you identify trends and analyze website traffic in relation to the days of the week.
Default Events
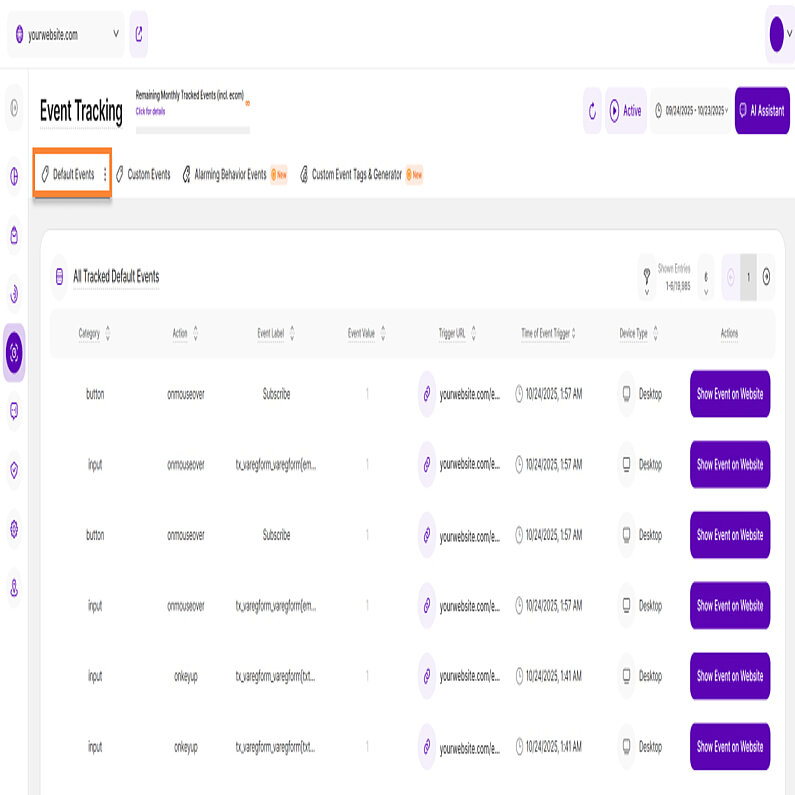
The Default Events tab provides a complete overview of every default event triggered by website visitors within the specific timeframe you selected. It is split into two insightful sections:
This table provides an overview of all website's default events triggered by its visitors during the selected period.
A default event refers to tags that have been automatically added to certain elements on your website (e.g., buttons, images). Your website team did not manually create these event tags and/or insert them into your website's source code. The platform automatically recognizes these standard event tags and lists them when the respective event is triggered by website visitors. Of course, these tags are only of limited significance, but they do allow for initial, very superficial evaluations.
Each row represents one occurrence of a default event. If an event was triggered multiple times within the selected time frame, multiple rows will appear for that event.
The All Tracked Default Events table contains the following columns:
- Category: This column displays the event category: for automatically recorded events, the HTML element type automatically recognized by the platform (e.g., "input," "button," "checkbox").
- Action: This column displays the action of the event: for automatically recorded events, the trigger type (e.g., onclick, onmouseover).
- Event Label: This column displays the event name: for automatically recorded events, the name of the page on which the event occurred.
- Event Value: This column displays the event value: for automatically recorded events, the default value is 1.
- Trigger URL: This column shows the full URL of the page where the event was triggered. Clicking on the link icon next to the page URL will open up the corresponding page in a new tab.
- Time of Event Trigger: Shows the precise date and time each event was triggered on your website.
- Device Type: This column displays the device type used when the event was triggered.
- Actions: This column lets you jump to where the auto-tracked event occurred on your website by clicking the Show Event on Website button. An overlay will also display additional stats about this and other events triggered on the same page. Learn more about it here: Auto-Tracking Previewer.
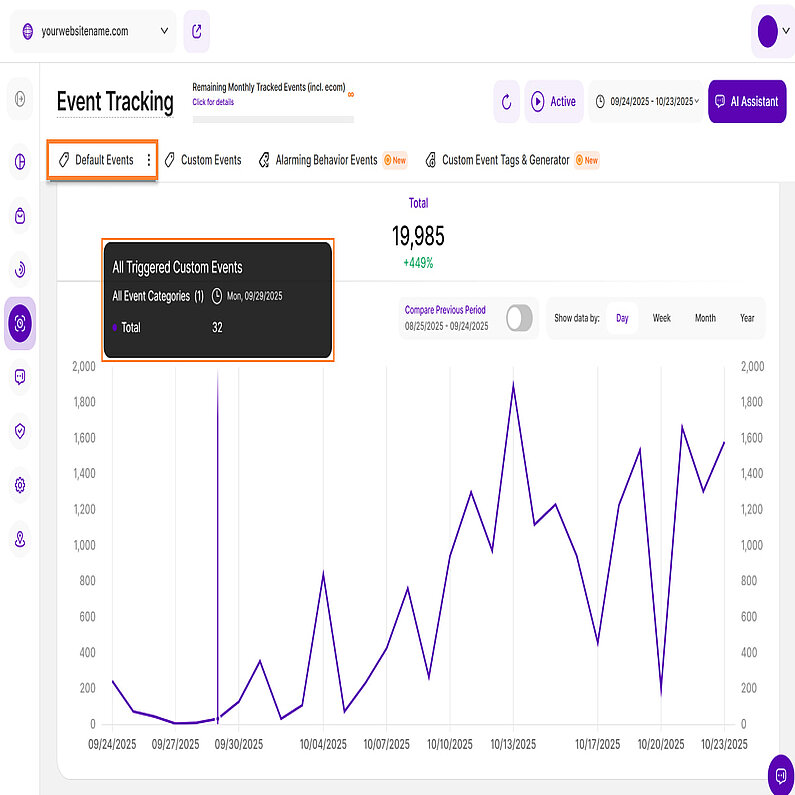
This section visually reflects the data presented in the All Tracked Default Events table.
The total number of all default events is displayed on top of the table. A corresponding percentage next to this total compares the current data to the previous period. Green indicates improved performance, while red signals a decline, which provides you a quick visual summary of your default events.
Ensure that the desired viewing period is selected so that the data matches what you want to see. The default setting is "Last 30 days."
The diagram initially shows only one line, representing the total number of all tracked default events currently displayed in the table. Use the Compare Previous Period radio button (located on the top right) to benchmark your current data against the equivalent period immediately before it. When this is enabled, a light purple line will appear on the diagram illustrating the data from that previous time frame.
To get granular details, simply hover your cursor over any data point on the line diagram. This action will display a tooltip with relevant insights, including a side-by-side comparison of each period when the Compare Previous Period button is enabled.
For better analysis, you can group the data within this chart by days, weeks, months, or years, allowing you to observe trends at various granularities.
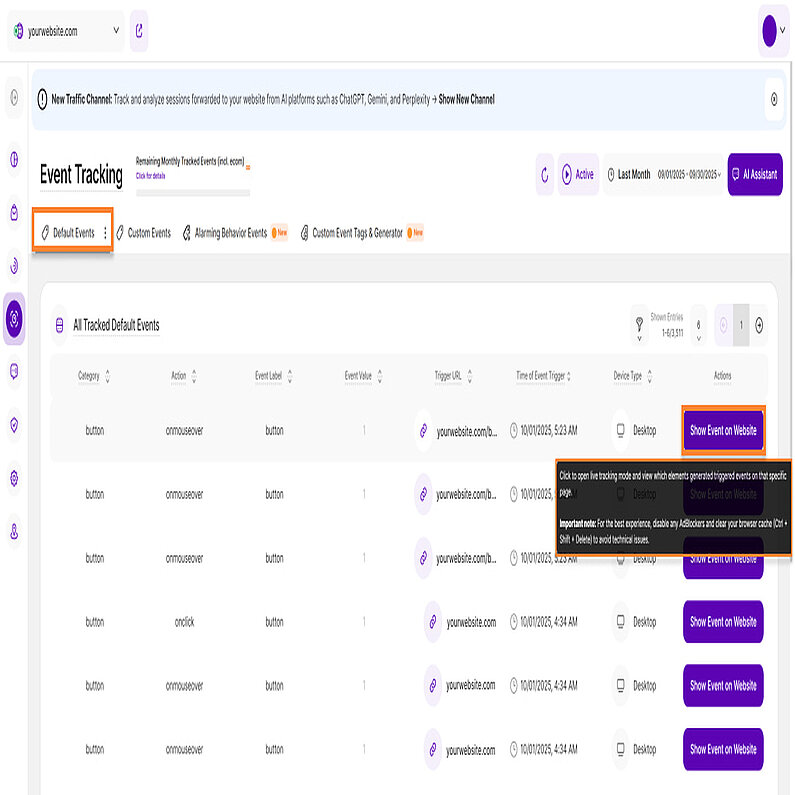
In the All Tracked Default Events table, you’ll find the Show Event on Website button located under the Actions column.
Click it to open live tracking mode and view exactly which elements generated triggered events on that specific page.
Important note: For the best experience, disable any AdBlockers and clear your browser cache (Ctrl + Shift + Delete) to avoid technical issues.
Once you click the Show Event on Website button, you will enter Live-Tracking View of default events. The screen highlights three critical components:
- Live-Tracking Mode Settings Icon: Tap this icon to open the settings.
- Button element: In this sample, we have the "Subscribe" button.
- Breakdown of the events tracked for the BUTTON element: This box shows a complete breakdown of the default events tracked for this button element for the selected time period. It shows the event type(s), the breakdown for each of the devices types and the grand total.
Tapping the Live-Tracking Mode Settings Icon, will open the settings view.
Every row of this Settings Menu shows your defined settings and some of the auto tracked elements related information:
- Results Based on Period: All the displayed results are based on the selected period of time. If you wish to see the data for a different interval, go back to the app, change the period and re-open the previewer. Note that the numbers do not update in real time, so any event occurring while being here will not be visible, unless you reload the page or close the previewer and get back to it.
- Sum of auto-tracked elements on page: This is the total number of auto-identified elements on this page. This does not mean that there are actions tracked on all of them, it is just a count of elements that can be auto-tracked on this URL. Hover each of the elements highlighted for more details to display.
- Sum of tracked auto-event triggers: The number of all event triggers that were tracked for all your auto-identified elements in the selected period of time.
- Show trigger sums & all auto-tracked default events: Activating this option will highlight all default elements which could be auto-detected by our system(only visible for you in this live tracking mode). Furthermore you will see a sum of all event triggers for each highlighted element in the selected period of time. Clicking on these trigger sums will provide you with more details about how this sum is generated.
Important Notes:
- To make sure you have the best user experience possible, please deactivate all AdBlockers so that you do not encounter any technical issues when using this. Also, please make sure you also clear the cache memory of your browser (Ctrl + Shift + Delete).
- The displayed amount of triggers always refer to the time period previously selected within the app.
- During the event preview mode your visit is NOT counted nor do your actions cause any event trigger count.
Hint: Our tracking may not currently capture data from invisible elements that appear only after a visitor interacts with the website. This includes elements like login text input fields, search fields revealed by clicking an icon, etc. These interactive elements may appear as "0" on the live preview because they aren't visible when the page first loads, but they are tracked correctly on the table. We're currently working on improvements to capture data from these dynamic elements in the future.
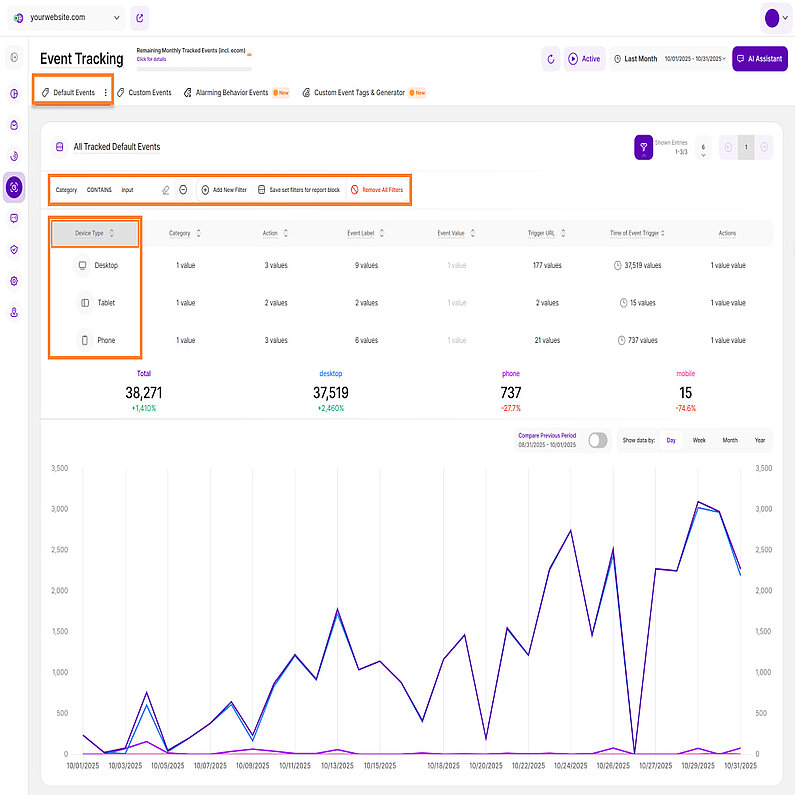
The tables for both Default Events and Custom Events offer various options for filtering, sorting and grouping. The main difference between filtering and grouping is relatively simple:
- Filters: Filtering narrows down the displayed events in the table by applying one or more criteria. The available filters are:
- Action
- Category
- Device Type
- Event Label
- Trigger URL
- Value
- Group Column: Grouping does not decrease the number of events visible in the table; instead, it links events based on the specified field. To activate it, click the Sort icon, toggle on the button next to Group Column, and click Apply. You have the option to further organize the results by choosing Sort Ascending or Sort Descending for the grouped columns.
In the example image, we first filtered the data by Category > ‘input’,then grouped by the Device Type column, and selected Sort Ascending.After this process, you can see a detailed breakdown and the total count for each item in the group, which appears directly beneath the table.
By interacting with the table, you'll quickly grasp the difference between grouping and filtering, unlocking simple yet powerful possibilities for data display and insight generation.
It is essential to understand the behavior of the line diagram. After grouping the data within the table, it becomes evident that to view the line diagram for a specific group, you must set the filter beforehand. Additionally, you have the option to select or deselect items within this group, streamlining the data to their needs. Deselecting an item will result in the removal of its corresponding line from the diagram.
Important Hints:
- The more filters you activate for the main able, the fewer events will be shown both within the table and the line diagram.
- You can easily create filter templates from your current filter settings. If you have a filter combination you plan to re-use later, simply click the Save set filters for report block button.
Custom Events
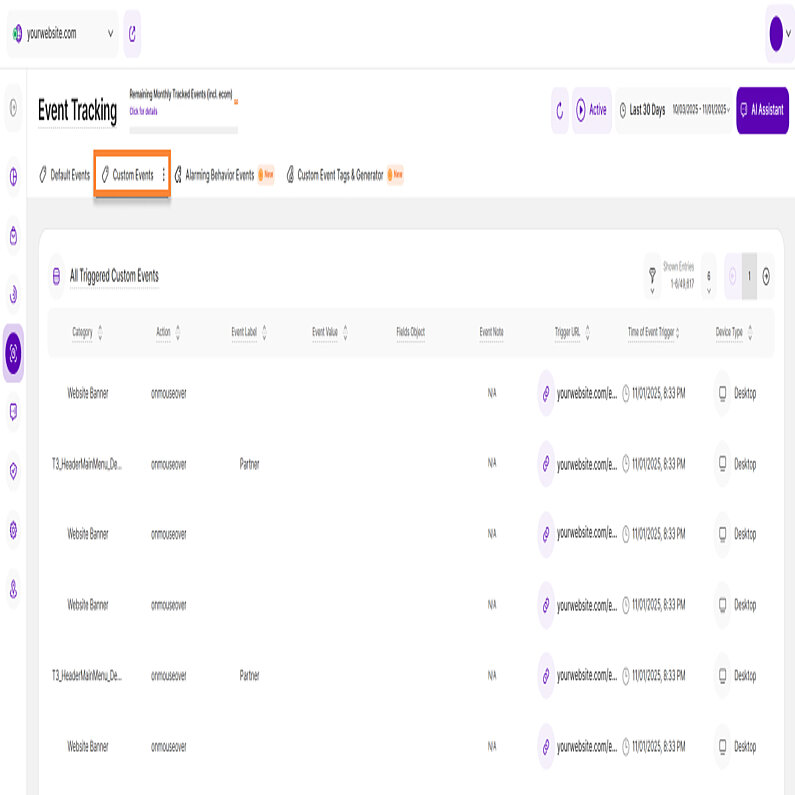
By clicking on the "Custom Events" tab (not available for Wix websites), you will find a familiar layout with two sections that provide a comprehensive overview of custom events and their visual timeline:
This table lists every instance a custom event was triggered on your website during the selected time range.
A custom event is a specific event tag that you or another website contributor generates (e.g., using the platform's event tag generator) and manually embeds in your website's source code. If the specified tag structure is adhered to when inserting the event tag into the source code of the website, the platform automatically records every trigger. Custom events allow you to track visitor interactions with selected website elements in a very targeted manner.
Each row represents a single instance — so if an event was triggered 20 times, it will appear 20 times in this list.
The table contains the following columns:
- Category: This column displays the event category: a user-defined name that you defined when creating a manual custom event tag. Usually the visual object on the web page that was interacted with (e.g., "button" /
"form" / "menu item" / "hero button" / etc.). - Action: This column displays the action of the event: the value you entered for the corresponding field when manually creating the event. Ideally, the content of the field provides information about which visitor action triggered the event (e.g., 'onclick' /'onmouseover /
'onkeyup" /'download' / form_submit" /"social_share' /'user_signup'). - Event Label: This column displays the event label: the value you entered for the corresponding field when manually creating the event. This field is intended to allow you to better distinguish between similar, manually created custom events later on
(e.g., "Book call," "Contact," "Submit form," "Our services"). - Event Value: This column displays the event value: the value you optionally entered for the corresponding field when manually creating the event. The field was created to allow you to add a numerical value that you want to associate with the event. This value could be used to rank the importance of an action (e.g., "50" for clicking the
"Book a call" button, which indicates the estimated value of a visitor to the "Book a call" page, or
"30" for clicking "Contact," which indicates the estimated value of a visitor to the
"Contact" page). There are, of course, completely different ways to use the field. Ultimately, it is another distinguishing feature of an event tag. - Fields Object: The value you optionally entered for the corresponding field when manually creating the event. This additional field could have been used, for example, to add further parameters that make it easier to distinguish this event from similar events later on (e.g., you could add the destination link, i.e., where clicking on a button leads to).
- Event Note: This column displays any notes that a contributor may have added to the custom event when creating it using the platform's custom event tag generator. This can help to better understand the context of a specific custom event (e.g., in teams).
- Trigger URL: This column shows the full URL of the page where the event was triggered.
- Time of Event Trigger: This column shows the precise date and time each event was triggered on your website.
- Device Type: This column displays the device type that was used to trigger the event on your website.
For more focused analysis, use the filter and group options to narrow down your data. Additionally, you can customize the number of entries per page and easily navigate through the data using pagination.
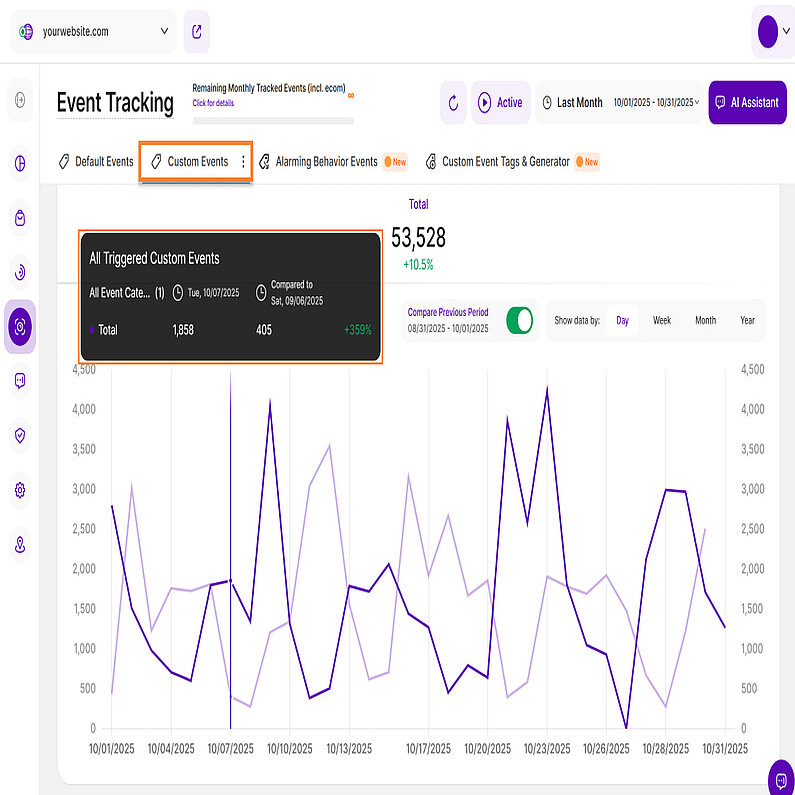
The line diagram visually reflects the data presented to you in the All Triggered Custom Events table. By default, you will notice only one line is visible. This line refers to the total number of events currently shown in the table above.
Similar to the Default Events view, you'll find a radio button labeled 'Compare Previous Period' on the top right of this section (with the corresponding dates underneath). This button lets you compare your current data to the equivalent time period before it. The data from that previous period is illustrated by a light purple line on the diagram.
To get more detailed information, simply hover your cursor over any data point on the line diagram. This action will display a tooltip with relevant insights, including a comparison of each period when the ‘Compare Previous Period’ button is enabled.
Here you find a list of all Alarming Behavior Event (ABE) categories that the platform is tracking. We are differentiating between 6 different categories being: Excessive Scrolling, Dead Clicks, Rage Clicking, Intense Mouse Movement, U-turns, and Rapid Page Reloads. All of those event categories can hint towards bad UX, technical bugs or lost conversions/revenue.
| Alarming Behavior Event | Technical Definition of Event | Use Case Suggestions | Action Item Suggestions |
|---|---|---|---|
| Excessive Scrolling | Scrolling a distance in pixels bigger than 3 * screen Height within 3 seconds. |
|
|
| Dead Clicks | A click that doesn't trigger a visual change, download action, opening a new tab or a URL change within 1s |
|
|
| Intense Mouse Movement | Moving the mouse a distance in pixels bigger than 2 * screen Width within 3 seconds |
|
|
| Rage Clicking | 5 or more clicks within 6 seconds that:
|
|
|
| Rapid Page Reloading | Refreshing a page/URL 3 times within 7 seconds |
|
|
| U-Turns | A change from URL A to URL B and then back to URL A within 7 seconds |
|
|
To help you analyze this data effectively, we offer two visualization options: a split table with a line chart and a split table with a pie chart. Click the icon next to the title of the "Alarming Behavior Events" report to change the visualization option for the report.
The tab also contains further details about such sessions (e.g., session recordings) that generate specific behavioral events. The table and visualizations show data on various alarming behavioral events that were recorded on the website. They help you identify potential interaction problems and improve the visitor experience.
The report block's first visualization option is the Split Table / Line Diagram and this is ideal for visualizing changes over time.
The left side of the split table shows the Alarming Behavior Events Category Table, which includes four columns:
- Category: his column lists the six types of Alarming Behavior Events (ABEs) the platform tracks, which can indicate poor UX, bugs, or lost conversions. We've categorized it into six types: Excessive Scrolling, Dead Clicks, Rage Clicking, Intense Mouse Movement, U-Turns, and Rapid Page Reloading.
- # of Detections: This column shows the total number of times each alarming behavior event type was detected on the displayed page URL during the selected time period.
- % of Total Events: This column shows the percentage of total alarming behavior events that each category accounts for in the selected time period.
- Actions: Use these action buttons to dig deeper into a category:
- Detail View: Detailed view of this event category and its occurrences throughout your website
- View Session Recordings: Jump straight to recordings that include this behavior.
Important Notes:
- The first three columns can be sorted by ascending or descending order.
- You can apply the filtering option to refine your data.
- Easily customize the number of entries per page and navigate through the data using the pagination buttons.
- Resize the table and chart sections using the horizontal arrow icon.
- Each category is represented by an icon with a colored dot.
On the right side of the split table, you'll find a dropdown menu at the top where you can choose which secondary metric you want to display within the line chart below.
We have two secondary metrics, ‘Number of Category's Event Triggers’ and ‘% of all Alarming Behavior Events’. By default, ‘Number of Category's Event Triggers’ is selected.
Customize your view by selecting one or more categories from the left table. You can select and deselect it to compare the data.
Click any data point to view more details including the date range, the total count of ABE events, and a direct link to pre-filtered session recordings highlighting these ABE events during the selected time period.
For better analysis, the data can be grouped by days, weeks, months, or years within this chart.
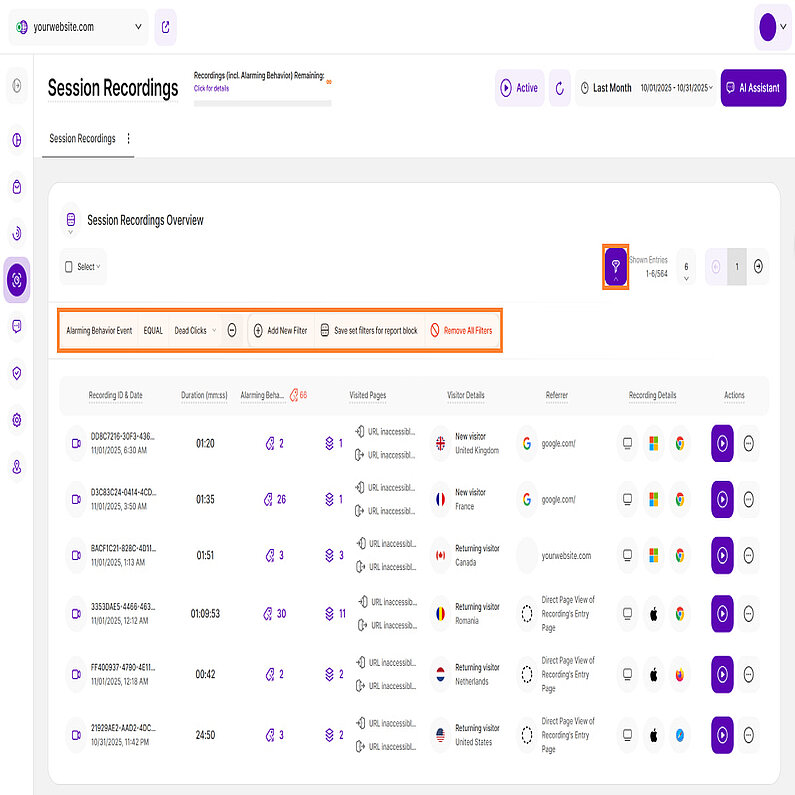
To dive deeper into the Alarming Behavior Events (ABE), click any data point on the line diagram to access the tooltip, and then click on the link to access the pre-filtered session recordings table.
These session recordings contain specific ABEs, allowing you to better understand visitor interactions in context.
The Session Recordings Overview table is organized with the following key columns:
- Recording ID & Date: This column shows the session recording's unique ID, which is generated automatically by the platform. You can use these IDs to search in the report block's filters. The date and time indicate when the respective session recording was created.
- Duration (mm:ss): This column displays the duration of each session recording in minutes and seconds.
- Alarming Behavior Events: This column displays the number of alarming behavior events (such as rage clicks, dead clicks, excessive scrolling, etc.) that occurred during each session recording.
- Visited Pages: This column shows the number of different pages visited during the session recording. Additionally, it displays the visitor's entry and exit pages for the session. Hover over each element for more details. Depending on your website's data protection settings, certain information may not be available.
- Visitor Details: This column shows the visitor type for each session recording, with our platform distinguishing between new, returning, and converted visitors.
- Referrer: This column displays the referrer URL through which the visitor reached your website, triggering the session recording.
- Recording Details: This column provides details about the device type, operating system, and browser used during the recorded session.
- Actions: This column lists all available actions for each session recording within the report block.
- View Session Recording Icon: Clicking this icon opens the full session recording video, allowing you to see the visitor interaction in context.
- More Options button: Offers additional actions: Mark as Favorite, Add a note, Mark as Watched, Copy Recording's Link, and Delete Recording. Find more information here.
Management tools are located on the top bar: Bulk Action (top left) and the Filter option (top right). You can also customize entries per page and navigate the data using pagination.
The second visualization option is the Split Table / Pie Diagram and this is perfect for visualizing data as proportions of a whole.
Same as the first option, you'll find the Alarming Behavior Events Category Table on the left table and the dropdown menu at the top of the right table where you can choose which secondary metric you want to display within the pie diagram below.
We still have the two secondary metrics, ‘Number of Category's Event Triggers’ and ‘% of all Alarming Behavior Events’. By default, ‘Number of Category's Event Triggers’ is selected.
This table features both a pie chart and a bar chart. Every bar in the bar chart stands for a different Alarming Behavior Events category. On the right, you can see the percentage showing how much of the total detections came from that category. Right below it, you'll see the total amount of detected occurrences of the selected ABE category in the chosen period of time.
When you hover your cursor over each section of the pie chart, the number of detections or the percentage related to the ABE category will be displayed depending on the secondary metric selected.
By using this visualization, you can easily identify the most frequent ABE categories affecting your website.
For each main Alarming Behavior Event category the user can now access a detailed view of it by clicking on the 'Detail View' icon under the Actions column.
The detailed view contains two RBs (each just one visualization):
1. On the left the table shows a list of website pages on which the selected Alarming Behavior Event category was registered during the selected period of time. It also shows you the referring sites of the visits that generated those Alarming Behavior Events on the respective page and the first and last time this event category was registered on this page. Selecting a page on the left will provide the user a historical overview of the occurrences of the Alarming Behavior Event category on that page within the right part of the RB. The user can also choose the secondary metric, ‘Number of Category’s Event Triggers', on website for the line diagram.
2. On the left the table shows recordings of sessions for which our app captured the selected Alarming Behavior Event category during the chosen time period. The table on the left basically provides the same information as the already known session recordings table on live. Selecting a row will open the session recording’s ‘Preview’ on the right for a quick view. The user finds two buttons below the session recording either opening the known detail view of that session recording or the session recording overview which is pre-filtered to the Alarming Behavior Event category selected.
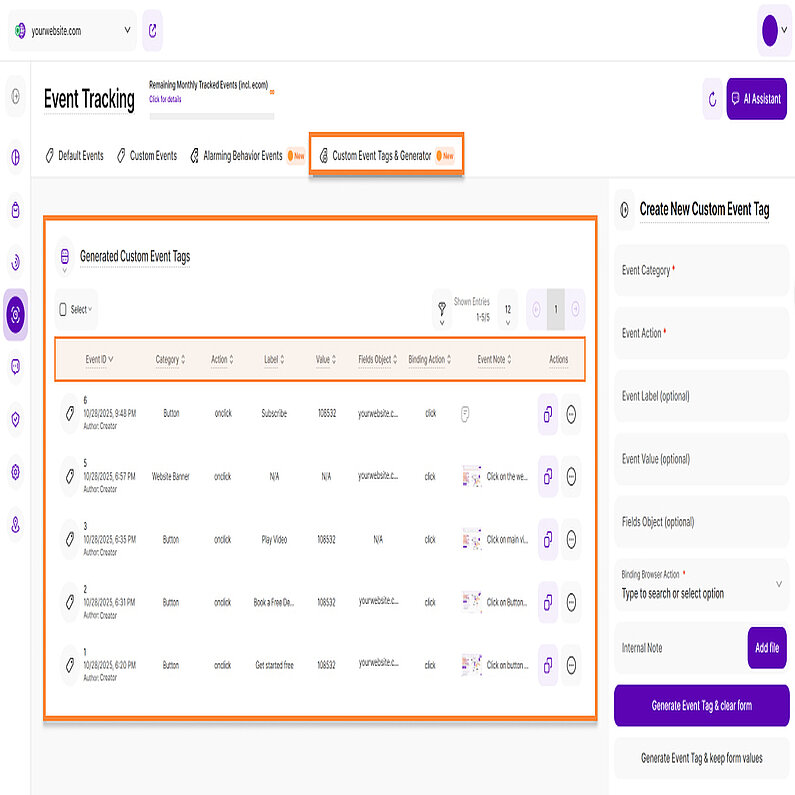
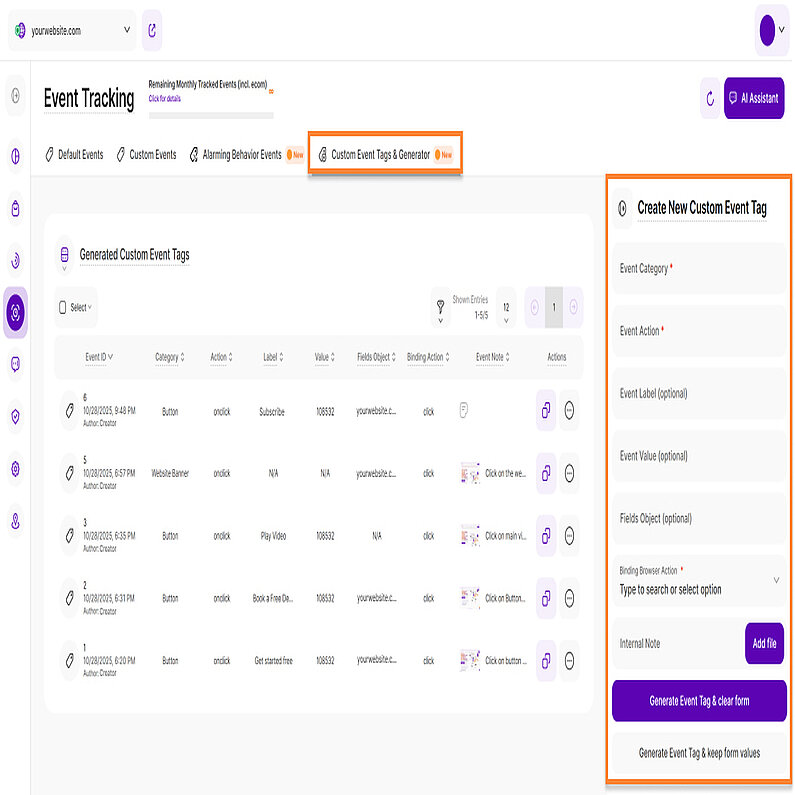
To the right of the Generated Custom Event Tags table, you'll find the Create New Custom Event Tag form. Use the fields provided within this form below to precisely define your custom event tags. You have full control over your tags: you can update or delete a custom event tag at any point in time.
Below are the fields for creating a custom event tag:
- Event Category (mandatory): Typically represents the visual object on the website that was interacted with (i.e. 'Button' / 'Form' / 'Menu Item' / 'Hero Button' / etc.). Event Action
- Event Action (mandatory): Define the specific visitor interaction that will trigger the event (e.g., 'onclick', 'onmouseover', 'onkeyup', 'download', 'form_submit', 'social_share', 'user_signup'). Unlike the 'Binding Action' field below, this action will appear in the triggered custom events table.
- Event Label (optional): Define a descriptive term to identify the specific event, helping you distinguish between similar manually created custom events later (e.g., 'Book a Call', 'Contact Us', 'Submit Form', 'Our Services').
- Event Value (optional): Assign a numeric value to represent the importance of the event (e.g., '50' for a 'Book a Call' button click or '30' for a 'Contact Us' click), helping estimate the relative value of different visitor interactions.
- Fields Object (optional): Optional field for including extra parameters to help distinguish this event from others—such as the destination URL of a clicked button. Type to search or select option
- Binding Browser Action (mandatory): This field tells the browser exactly when to trigger the tag, based on recognized actions from the dropdown list. The browser can only recognize the values provided in this dropdown. It's required for proper tag execution. Use it alongside the freely defined "Event Action" field above, which appears in event reports, while this binding is used behind the scenes to make the tag work. For a complete list of supported HTML events, please refer to our HTML Events (Binding Actions) section.
- Internal Event Note (optional):This field allows you to add an internal event note detailing the custom event tag's purpose, intended tracking, or any special instructions for other contributors. You can use the Add file button to add a descriptive image for visual clarity. Supported Formats: PNG, JPG & SVG, Max File Size: 1 MB.
After you have defined all the fields above and have chosen the action you want the event to fire upon, you can choose between the following buttons:
- Generate Event Tag & clear form: This button generates the custom event code and then clears all values from the form fields, allowing you to quickly begin defining a new tag from scratch.
- Generate Event Tag & keep form values: This button generates the custom event code and retains all the current values in the form fields. Use this option when you need to create several similar tags that only require minor changes (e.g., changing only the 'Action' or 'Label').
Once you've generated a new custom event tag (e.g., va('send', 'action', 'category', 'action', 'label', 'value', 'fieldsobject')), you'll need to manually integrate it into your website's source code - typically by linking it to the element for which you want to track interactions, such as a button.
After integration, the platform will automatically track the custom event each time it's triggered. All tracked custom events will appear in the 'Custom Events' tab.
HTML Events (Binding Actions)
Here's a complete list of HTML events that can be used to trigger actions:
| Event | Occurs When |
|---|---|
| abort | The loading of a media is aborted |
| afterprint | A page has started printing |
| animationend | A CSS animation has completed |
| animationiteration | A CSS animation is repeated |
| animationstart | A CSS animation has started |
| beforeprint | A page is about to be printed |
| beforeunload | Before a document is about to be unloaded |
| blur | An element loses focus |
| canplay | The browser can start playing a media (has buffered enough to begin) |
| canplaythrough | The browser can play through a media without stopping for buffering |
| change | The content of a form element has changed |
| click | An element is clicked on |
| contextmenu | An element is right-clicked to open a context menu |
| copy | The content of an element is copied |
| cut | The content of an element is cut |
| dblclick | An element is double-clicked |
| drag | An element is being dragged |
| dragend | Dragging of an element has ended |
| dragenter | A dragged element enters the drop target |
| dragleave | A dragged element leaves the drop target |
| dragover | A dragged element is over the drop target |
| dragstart | Dragging of an element has started |
| drop | A dragged element is dropped on the target |
| durationchange | The duration of a media is changed |
| ended | A media has reach the end ("thanks for listening") |
| error | An error has occurred while loading a file |
| focus | An element gets focus |
| focusin | An element is about to get focus |
| focusout | An element is about to lose focus |
| fullscreenchange | An element is displayed in fullscreen mode |
| fullscreenerror | An element can not be displayed in fullscreen mode |
| hashchange | There has been changes to the anchor part of a URL |
| input | An element gets user input |
| invalid | An element is invalid |
| keydown | A key is down |
| keypress | A key is pressed |
| keyup | A key is released |
| load | An object has loaded |
| loadeddata | Media data is loaded |
| loadedmetadata | Meta data (like dimensions and duration) are loaded |
| loadstart | The browser starts looking for the specified media |
| message | A message is received through the event source |
| mousedown | The mouse button is pressed over an element |
| mouseenter | The pointer is moved onto an element |
| mouseleave | The pointer is moved out of an element |
| mousemove | The pointer is moved over an element |
| mouseover | The pointer is moved onto an element |
| mouseout | The pointer is moved out of an element |
| mouseup | A user releases a mouse button over an element |
| mousewheel | Deprecated. Use the wheel event instead |
| offline | The browser starts working offline |
| online | The browser starts working online |
| open | A connection with the event source is opened |
| pagehide | User navigates away from a webpage |
| pageshow | User navigates to a webpage |
| paste | Some content is pasted in an element |
| pause | A media is paused |
| play | The media has started or is no longer paused |
| playing | The media is playing after being paused or buffered |
| popstate | The window's history changes |
| progress | The browser is downloading media data |
| ratechange | The playing speed of a media is changed |
| resize | The document view is resized |
| reset | A form is reset |
| scroll | An scrollbar is being scrolled |
| search | Something is written in a search field |
| seeked | Skipping to a media position is finished |
| seeking | Skipping to a media position is started |
| select | User selects some text |
| show | A <menu> element is shown as a context menu |
| stalled | The browser is trying to get unavailable media data |
| storage | A Web Storage area is updated |
| submit | A form is submitted |
| suspend | The browser is intentionally not getting media data |
| timeupdate | The playing position has changed (the user moves to a different point in the media) |
| toggle | The user opens or closes the <details> element |
| touchcancel | The touch is interrupted |
| touchend | A finger is removed from a touch screen |
| touchmove | A finger is dragged across the screen |
| touchstart | A finger is placed on a touch screen |
| transitionend | A CSS transition has completed |
| unload | A page has unloaded |
| volumechange | The volume of a media is changed (includes muting) |
| waiting | A media is paused but is expected to resume (e.g. buffering) |
| wheel | The mouse wheel rolls up or down over an element |
Integrating an Event Tag Within Your Website
Once you generate your new event tag, integrate it into your website by adding it to each element you want to track (depending on your website builder platform). You can add the tag our app provides, either directly within the element's code or as a separate script, as shown in the tutorial below.
Here is an example for a button in HTML and how it should look like so that the click on that button is tracked as an event:
<button id="important-btn">Click me!</button>
Option A: JS snippet
<script>
document.getElementById("important-btn")
  .addEventListener("click", function(){
    va("send", "event", "example-category", "btn-click", "Important Button")
  });
</script>
Option B: directly on the element
<h2 onclick="va('send', 'event', 'example-category', 'btn-click', 'important', 123);">Important button</h2>
Both options are semantically correct and do the same thing in the ideal case.
However, Option A allows for more flexibility. The limitation with Option B is that it might be overridden by some other JS code that is loaded after the DOM is rendered ( element.onclick = function(){ ... } ), thus causing our code never to be called.
In comparison, Option A allows an unlimited number of event listeners to be added (as long as the memory on the user agent device can withstand it).
Injecting Manually Created Custom Events with JavaScript
Instead of manually adding each JavaScript file to your HTML source code step by step, you can use JavaScript itself to inject other JavaScript files programmatically. This allows you to load scripts dynamically when they are needed, keeping your HTML cleaner and reducing initial load times. You can create a new <script> element using document.createElement("script"), set its src attribute to the URL of the script you want to load, and then append it to the document’s <head> or <body>. This automatically loads and executes the JavaScript file without requiring a page reload.
This approach is useful for loading libraries on demand, implementing modular scripts, or loading additional features only when users need them. It also makes it easier to manage dependencies in large projects without cluttering your HTML with multiple <script> tags. By letting JavaScript handle your script loading, you gain flexibility, improve maintainability, and open opportunities for smarter, condition-based loading in your applications.
The platform offers several options that allow you to precisely define the types of events you want to track.
To access the Module Settings, click the More Options button located within both the Default Events and Custom Events tab headers, and then select Event Tracking Settings.
For a comprehensive guide, please refer to this support article: Event Tracking Settings.


