Visitor Behavior
Introducing Our Behavior Analytics Features
Understand Customer Actions and Journeys
Use our visitor behavior analytics features to reach goals and increase success.
Make better design decisions
Perfect the visitor experience
Get more sales or signups
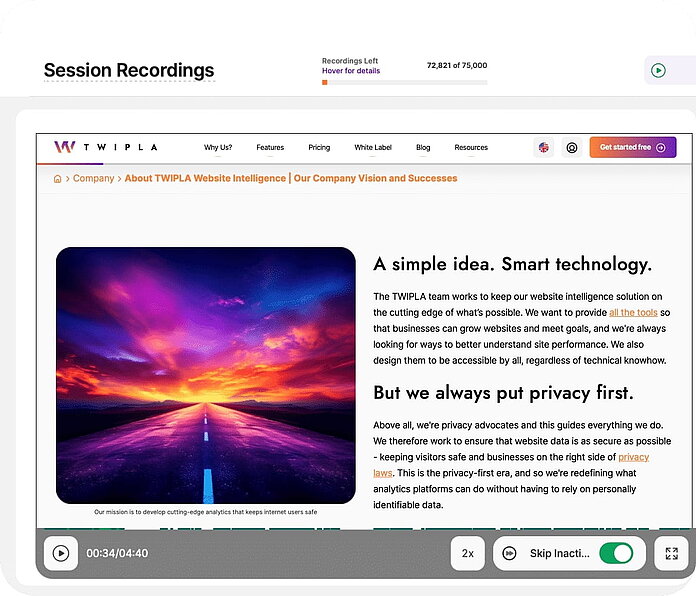
Session Recordings
Replay Any Visitor Journey
Watch videos of real browsing sessions to see how people engage with your pages and also move between them. Then, use this information to find confusion, doubt, and frustration. View your site from their perspective and use this information to improve your website.
Advanced Replay FilteringCross-Platform InformationCustomizable Data CollectionAdvanced Playback Reports
Find the session recordings you need quickly and also bookmark the ones you like. Moreover, sort them by visitor characteristics, pages visited, and traffic source. Alternatively, activate a multi-level filter or saved filter template for more relevant results. Finally, watch the replays or use the list of actions in data form.
Heatmaps
View Group Visitor Behavior
Create a heatmap to quickly understand page engagement, including clicks, scrolls, and mouse movement. Additionally, see where attention is high and where it’s low. Then, use this visual aid to spot technical issues, improve layouts, and make navigation easier.
So create one for a specific or dynamic page, or alternatively, use the URL pattern tool to filter data by campaign. Furthermore, see results by device type. From the color palette to recorded visit count, our heatmaps are fully customizable, and you can also see the data in list or map form.

LIVE REPORTING & DASHBOARDS
Bring Visitor Behavior Into Focus
Engagement doesn’t happen all at once, it unfolds across sessions, clicks, and journeys.
Dashboards help you surface those patterns as they emerge, making it easier to spot where attention builds, where it drops, and what deserves a closer look.
From live engagement signals in the Real-Time Analytics Dashboard to deeper page performance analytics, you can follow how visitors interact and move through your domain without losing sight of the bigger picture.
When you need more control, build your own dashboards using Behavior Analytics report blocks, alongside supporting insights from Web Statistics and Visitor Communication tools.
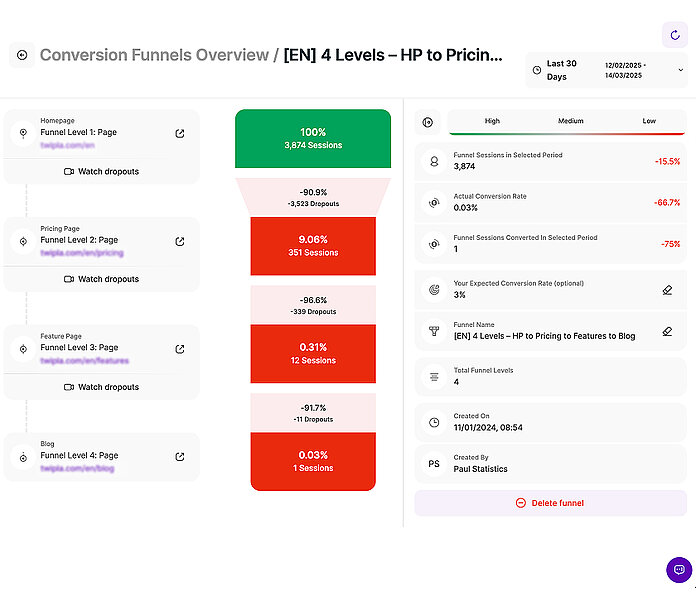
Conversion Funnels
Map Visitor Paths to Action
Link steps together for analysis so as to track the full path to conversion - whether visitors click through pages, match URL patterns, or trigger specific on-page events. Use this to uncover dropouts, friction points, or engagement patterns that impact performance. Then apply these insights to sharpen targeting, refine resource allocation, and boost conversion outcomes.
So build a funnel with up to 14 levels and start mapping visitor journeys across your site. Define each step using criteria such as pages visited, custom events triggered, eCommerce interactions, or even alarming behavior signals. Set expected conversion rates, filter by visitor attributes, and watch real videos of dropouts to see exactly where visitors exit on within your defined flows. Finally, jump to any step for deeper analysis and start turning clicks into results.

TWAIA: Your AI Analytics Assistant
Advice and Guidance Whatever Your Query
TWAIA follows you across TWIPLA, ready to answer any question, explain metrics in plain words, and guide you at every step. She’s your always-on AI copilot inside the platform, transforming raw data into crystal-clear insights and turning tricky analytics into guidance so simple it feels like magic.
Available to all Premium Plan users, TWAIA highlights visitor behaviors that matter most, like showing where people get stuck, which session recordings to watch, and which frustration signals might be hurting conversions.
And if you ever need a human touch, live chat support is also only a click away.
Event Tracking
Research Any Visitor Behavior
This visitor behavior tool goes beyond surface-level analytics by tracking how visitors interact with any page element, such as downloads, form submissions, checkboxes, and dropdowns. So go granular and use this data to fine-tune your site.
Automatic Event TrackingCustom Event TriggersIntegrated Events AnalyticsHistoric Event GraphLive Tracking Mode
This advanced feature requires a little setup; however, once you've created a tag and added it to the HTML, anyone can use it. Then, return to the overview to see how event frequency changes over time, or group and filter data for deeper analysis.