Event Tracking & Visitor Journey Analysis
Already tracking. Before you've set anything up.
Event Tracking & Visitor Journey Analysis records clicks on buttons, forms, dropdowns and checkboxes automatically, from the moment the script is installed. Define anything else you want to track as a custom event, and read the whole sequence back as one journey.
ANALYZEEvent Tracking & Visitor Journey Analysis is one of five Analyze tools. → Explore them all
AUTOMATIC EVENTS
Your buttons and forms tracked from day one.
Most event tracking starts with a blank list and a developer. This starts with data.
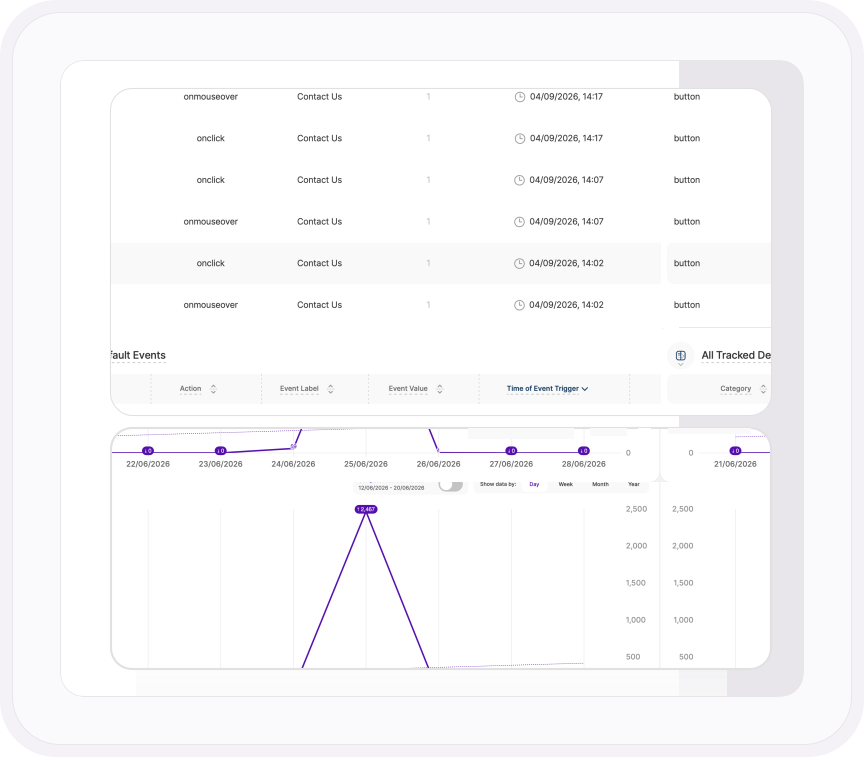
Buttons, input fields, text areas, dropdowns, checkboxes and radio buttons are tracked the moment TWIPLA is on your site, each one logged with its page, timestamp and device. Switch off any element or trigger you don't need, or pause everything with a single button. Either way, you won't spend your first week deciding what to track.
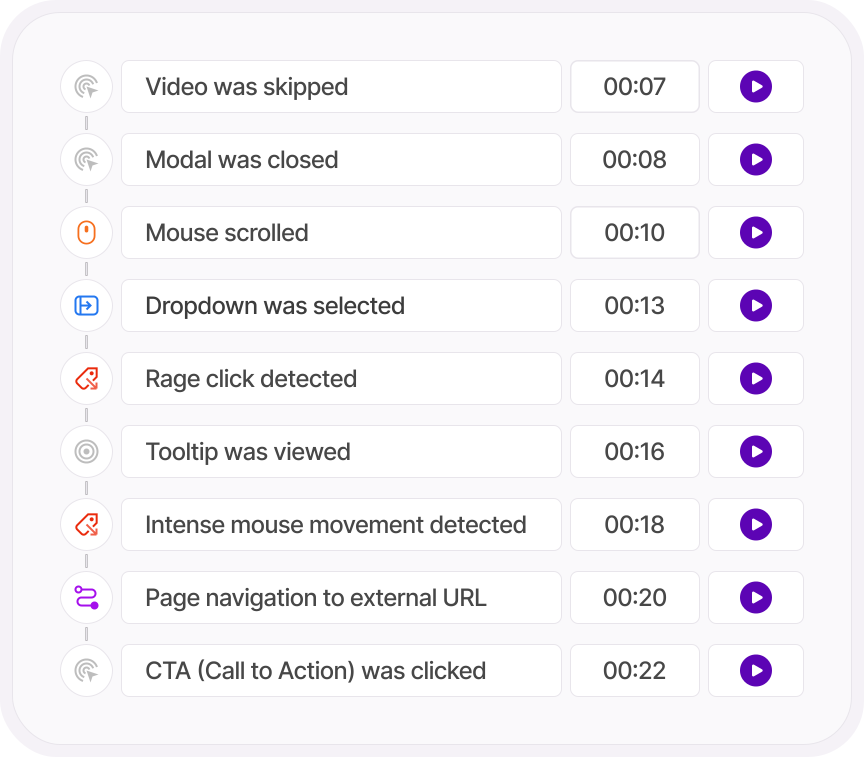
- Hovers are tracked as well as clicks, so you can see who hovered over a button and never pressed it
- Dead clicks, rage clicks, U-turns and rapid reloads flagged in their own report, with the session recordings behind each one ready to watch
- Any event can be a funnel step, so a button click becomes a stage you can measure drop-off from
CUSTOM EVENTS
For everything else, name it and paste it.
Video plays. Scroll depth. A form abandoned halfway. A file downloaded. If a browser can detect it, you can track it.
Fill in a category, an action and a label in the tag generator, choose from more than a hundred browser events, then copy the tag and paste it into your site.
Every tag you've ever made sits in one table with a note explaining why it exists, so the next person on the team doesn't have to guess.
- Give each tag its own value, then filter by it to pull out the events that matter most
- Attach a screenshot to any tag, and the element it tracks is never in doubt
- Generate a tag and keep the form filled in, so a second version takes seconds
LIVE TRACKING MODE
See the button. Not just the row.
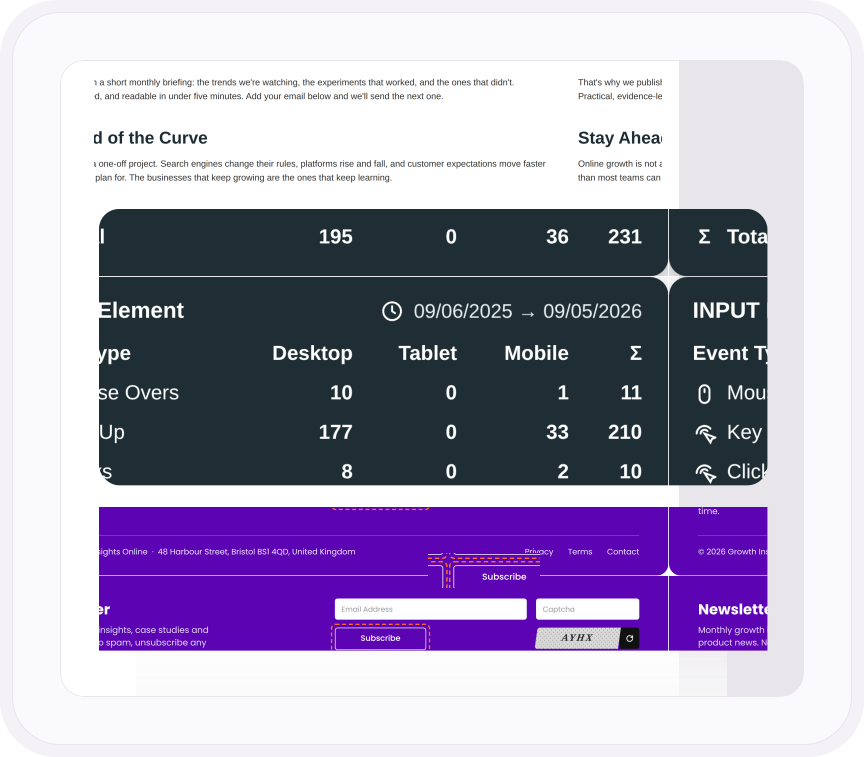
Click any event in the overview and TWIPLA opens the actual page it happened on, with the element highlighted and its trigger counts laid over it, split by device.
Other tools hand you a line in a table and leave you to work out which button it was. This shows you the button, then every other tracked element on the page, one click away.
- Filter events by the page they fired on or the campaign that brought the visitor there
- Chart any event by day, week, month or year, and compare it with the period before
- Set the range to your install date and see every trigger since the day TWIPLA went on your site
ONE PLATFORM, FOUR STAGES
Most analytics show you what happened. TWIPLA tells you what to do about it.
Every tool runs on the same setup, and the filters you set follow you from report to report. So a number on this page becomes a recording, a funnel or an answer in one click. Analyze is where the numbers turn into behavior. Here's the whole route.
- OBSERVE: See what's happening →
- ANALYZE: See how visitors behave YOU ARE HERE
- UNDERSTAND: See what it costs you →
- ACT: See what to do next →