- Why Us?
- Features
White Label
For SaaS Platforms & Agencies
Provide our complete analytics suite to your clients, directly within your own interface and with your/their own branding. Discover Analytics-as-a-Service and White Label Analytics. Great benefit, minimal effort.
- Pricing
- White Label
- Success Stories
- Partner
- ResourcesExpand Your Knowledge

Simon Coulthard November 27, 2025
5 min
CONTENTS
- Session Recordings - Two Updates
- 1. Filter Recordings by All eCommerce and Engagement Events
- 2. Entry and Exit Page Details Added to Playback View
- Pages Dashboard: Page Titles Added to Report
- Filters: New Referred AI Traffic Segmentation
- Tracking Code: Custom Domains Now Supported
- Visitors: Browser User Agent Insights Now Available
- Table Sorting: Clearer Visual Indicators for Default Sorting
- That's a Wrap for November 2025
Platform News - November 2025

Welcome to the November 2025 edition of our Platform News roundup. Once again, the development team has surpassed expectations, deploying a strong mix of new features, UX improvements, and deeper data discovery across many of our core analytics modules.
Behind the scenes, we’ve also been refining stability, boosting performance, and rolling out a series of smaller fixes to keep everything running reliably.
Use the Table of Contents to jump to what interests you most, or just scroll on to catch up on everything that's happened at TWIPLA since October.
Session Recordings - Two Updates
1. Filter Recordings by All eCommerce and Engagement Events
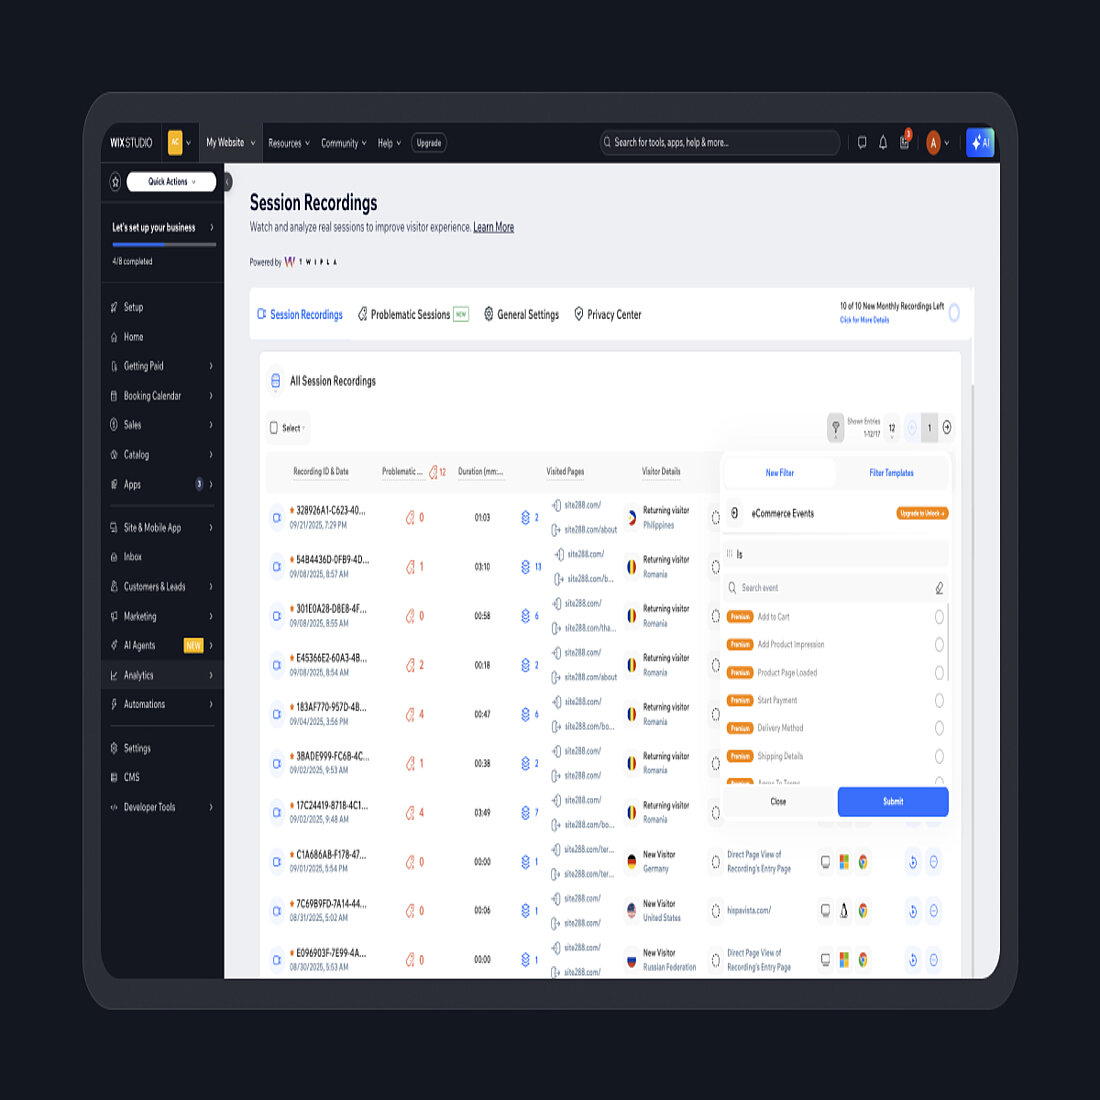
Filtering session recordings by meaningful visitor actions is one of the fastest ways to uncover the sessions that actually deserve your attention. Purchases, registrations, logins, bookings, and similar events reveal real intent, and focusing on those moments cuts straight through the noise.
For Wix plugin users, this now includes full filtering by every Wix eCommerce and engagement event, making it simple to isolate visits where something important happened.
Standalone TWIPLA users already have advanced event filtering across the platform, and this update brings Wix-based site analytics in line with that level of precision. So try out these deep session recording filters and see how much more you can learn from your visitors' experiences.
2. Entry and Exit Page Details Added to Playback View
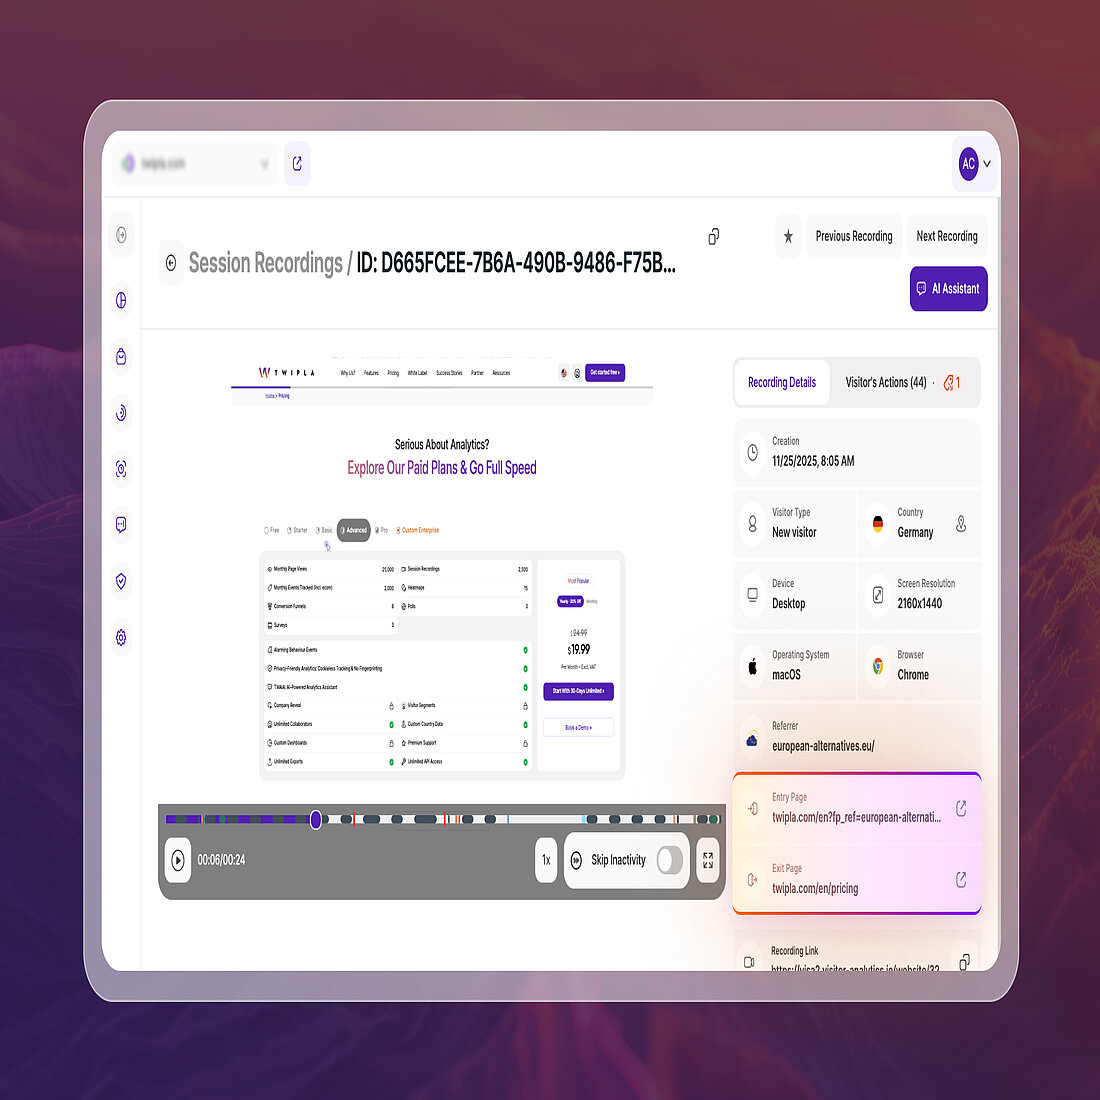
Session recordings now display entry and exit pages directly inside the playback detail view, giving you immediate context as you watch. You no longer need to switch back to the overview table to understand how a visitor reached the page you’re analyzing.
This matters because the first and last touchpoints often explain the behavior you see on screen. Knowing where a visitor arrived from helps you understand intent, and seeing where they go next highlights whether the page guided them forward or pushed them away.
Clients specifically asked for this inside the viewer, and it now mirrors the information already available in the session recordings overview table, making journey analysis smoother and more intuitive end to end.
To learn about these or any other session recordings functionalities, please visit the Support Center.
Pages Dashboard: Page Titles Added to Report
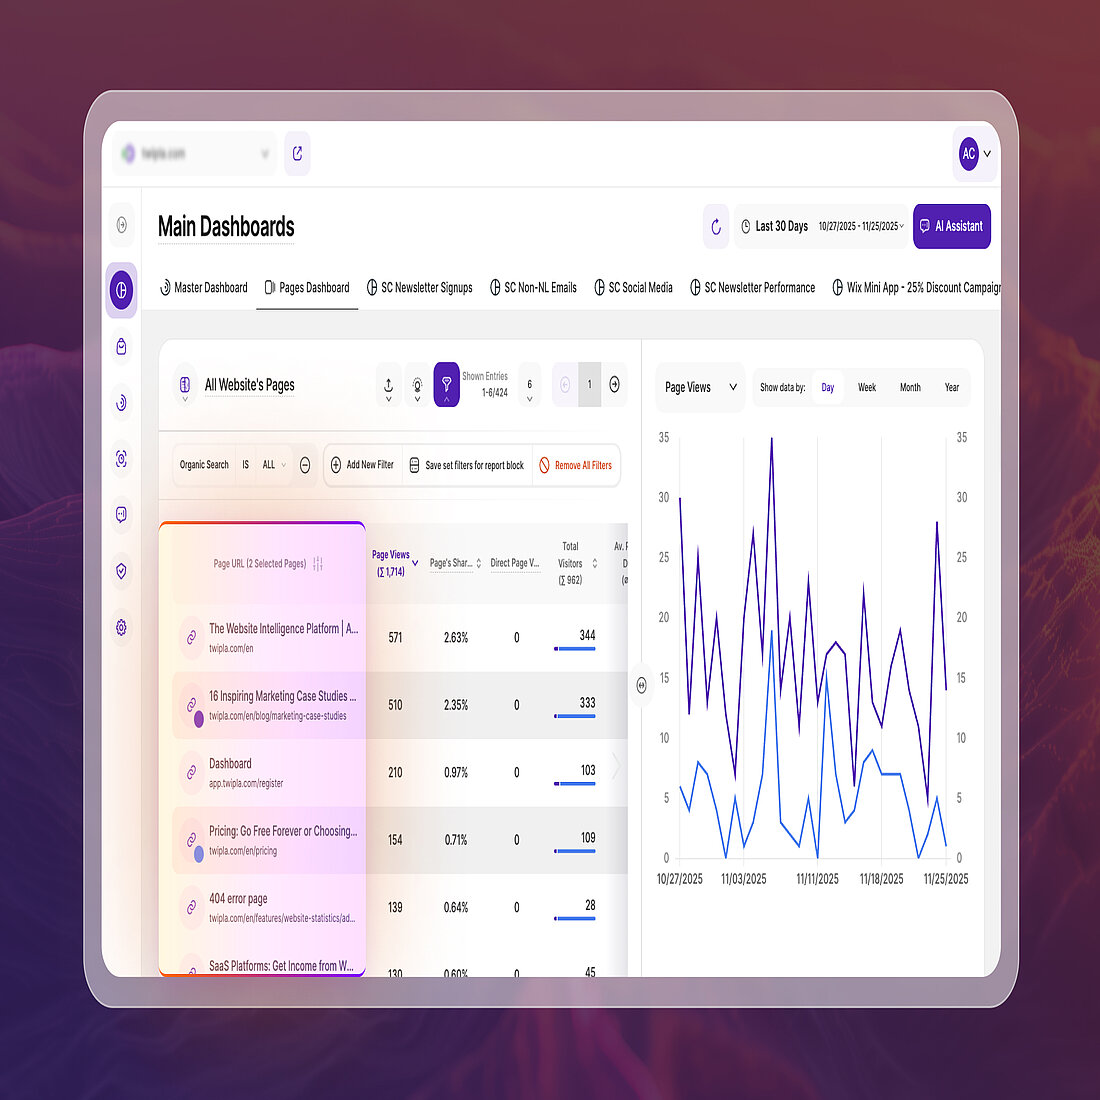
The Pages Dashboard now displays page titles directly inside the report, giving you a clearer view of your content at a glance. This small improvement removes the guesswork when working with long or similar URLs, especially for blogs, landing pages, and campaign content.
Adding page titles also brings this dashboard in sync with other reports across the platform, so you get the same structure and clarity no matter where you’re analysing your domain’s performance.
This update makes the Pages Dashboard even more useful as a tool for quickly assessing how each page contributes to your overall performance.
Learn more about our Main Dashboards in the Support Center.
Filters: New Referred AI Traffic Segmentation
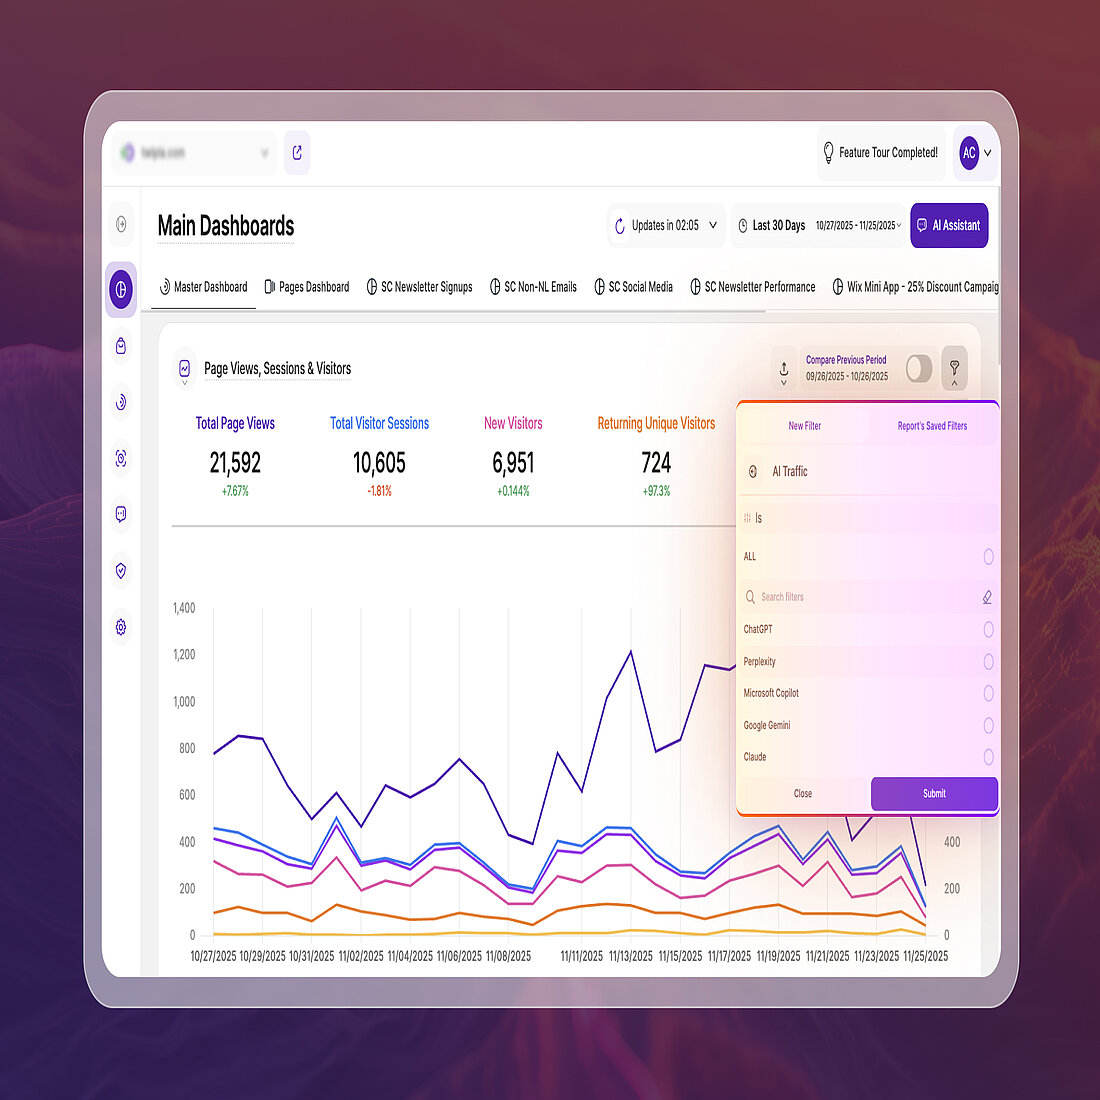
You can now analyse your data through a new category of AI Traffic filters.
Powered by the Traffic Structure module, these filters highlight referrals from ChatGPT, Perplexity, and other generative engines, making it easy to isolate visits driven by LLM platforms. This gives you a much clearer view of how AI-generated traffic contributes to your visibility and how these visitors behave across your domain.
The new filter has been added to many of the most important report blocks across the platform, making it easy to explore AI-generated traffic wherever it appears in your analytics. You’ll now find AI Traffic segmentation across many of our modules and submodules, including:
Generative Engine Optimization or GEO is quickly becoming a major opportunity for businesses aiming to strengthen their online visibility, and these filters make it easier to see how this emerging channel interacts with your domain and where new opportunities or friction points may be forming.
To learn more about these and other filters, please visit the Traffic Structure section of the Support Center.
Tracking Code: Custom Domains Now Supported
Maximise data capture with flexible snippet configurations
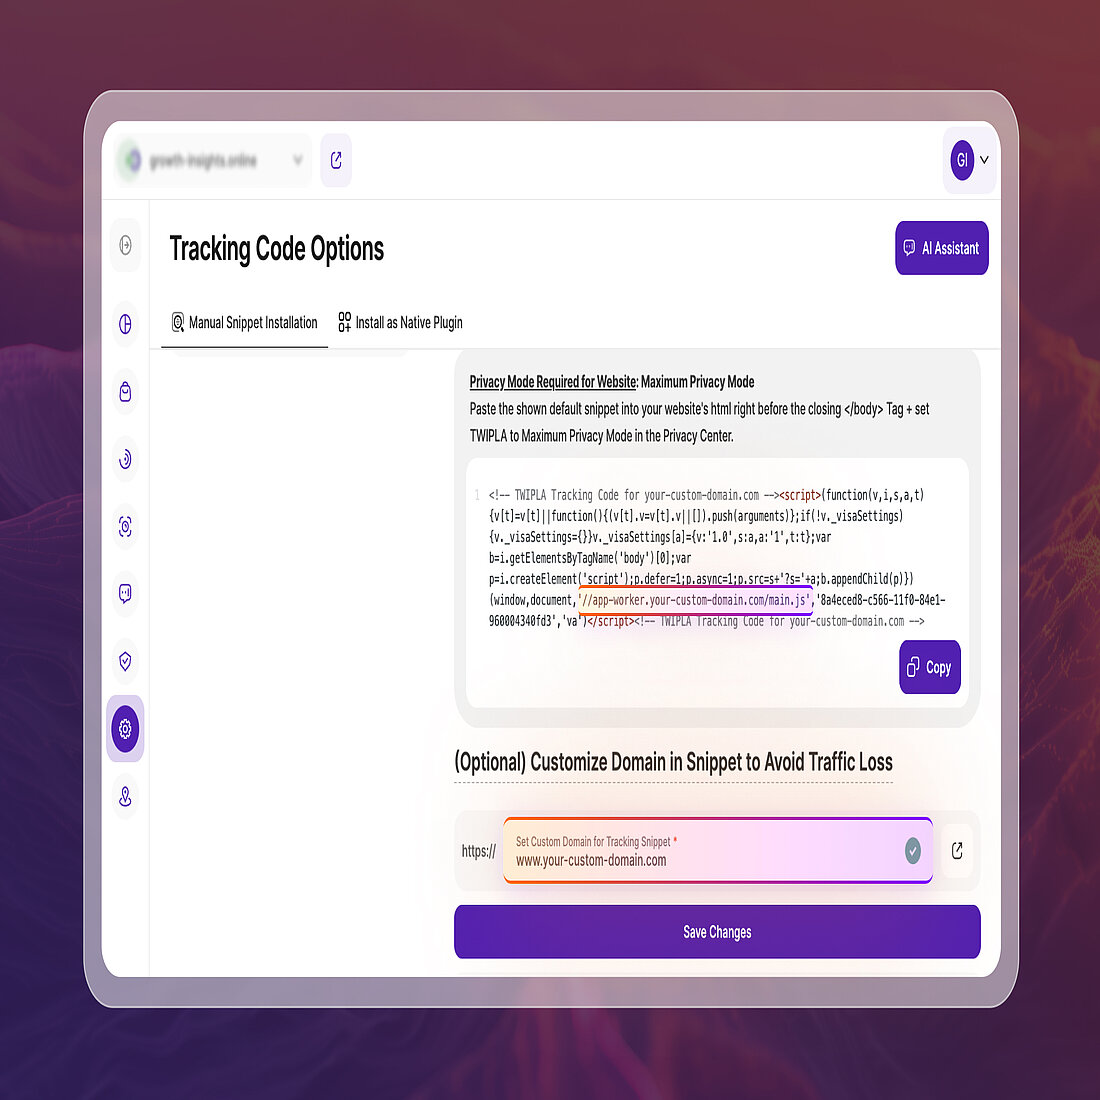
Standalone platform users can now customise the domain used by their TWIPLA tracking snippet, giving more control over how analytics is delivered and reducing the impact of ad blockers on data collection. This update lets users choose between using their domain, a subdomain, or the default TWIPLA domain, depending on how setup is structured.
Using your own domain or subdomain helps ensure more complete traffic data, especially for agencies and other white label users who present analytics under their own branding. With tracking requests now flowing through a domain that matches the branded environment, the experience feels fully integrated for contributors, clients, and team members.
It’s also useful for any business that wants a cleaner technical footprint with fewer third-party calls. You can use a simple CNAME setup or configure a full proxy, and the Support Center guide walks through each option so you can adopt the approach that fits your domain and infrastructure best.
For more information, prease read our Tracking Code Setup Guide the Support Center.
Visitors: Browser User Agent Insights Now Available
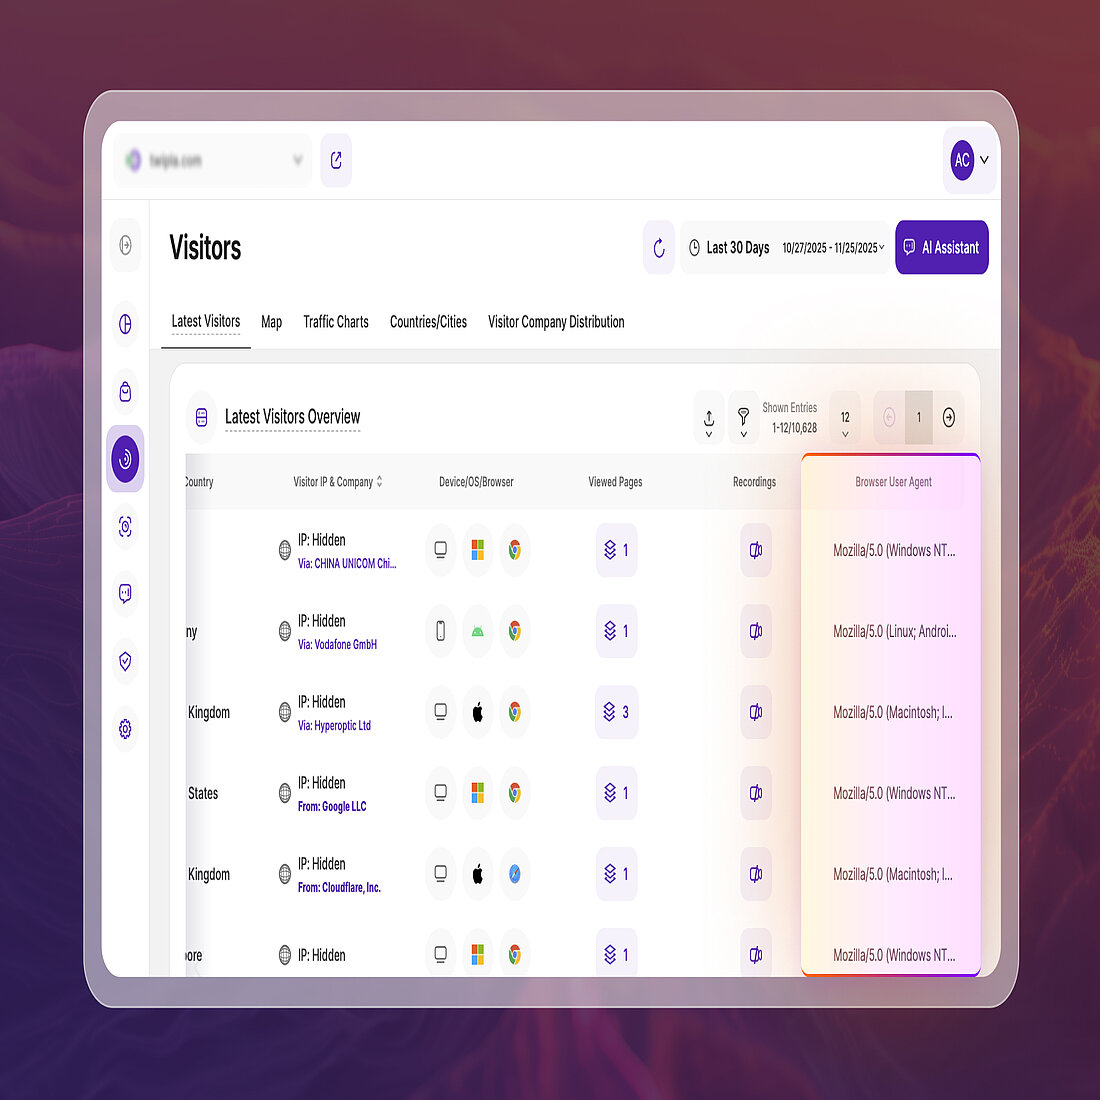
In Visitors, the Latest Visitors Overview now includes a Browser User Agent column to give you a clearer picture of the browser, version, and operating system behind every visit. This addition was a common client requests, and it brings far more transparency to the technical context of each session.
This information is particularly useful for teams who manage UX, development, CRO, or support, since it helps you spot device-specific issues, understand how different setups impact performance, and identify whether unusual behaviour is tied to a specific browser or OS. With the data also available in exports, it’s easy to share these insights with developers or agencies who need them.
More refinements are coming soon, including a dedicated filter to help you segment visitors by user agent directly inside the platform. This will make it even easier to troubleshoot, analyse trends, and ensure your domain works smoothly across the full range of devices your audience uses.
For more information about this or another other Visitors functionality, explore the Support Center.
Table Sorting: Clearer Visual Indicators for Default Sorting
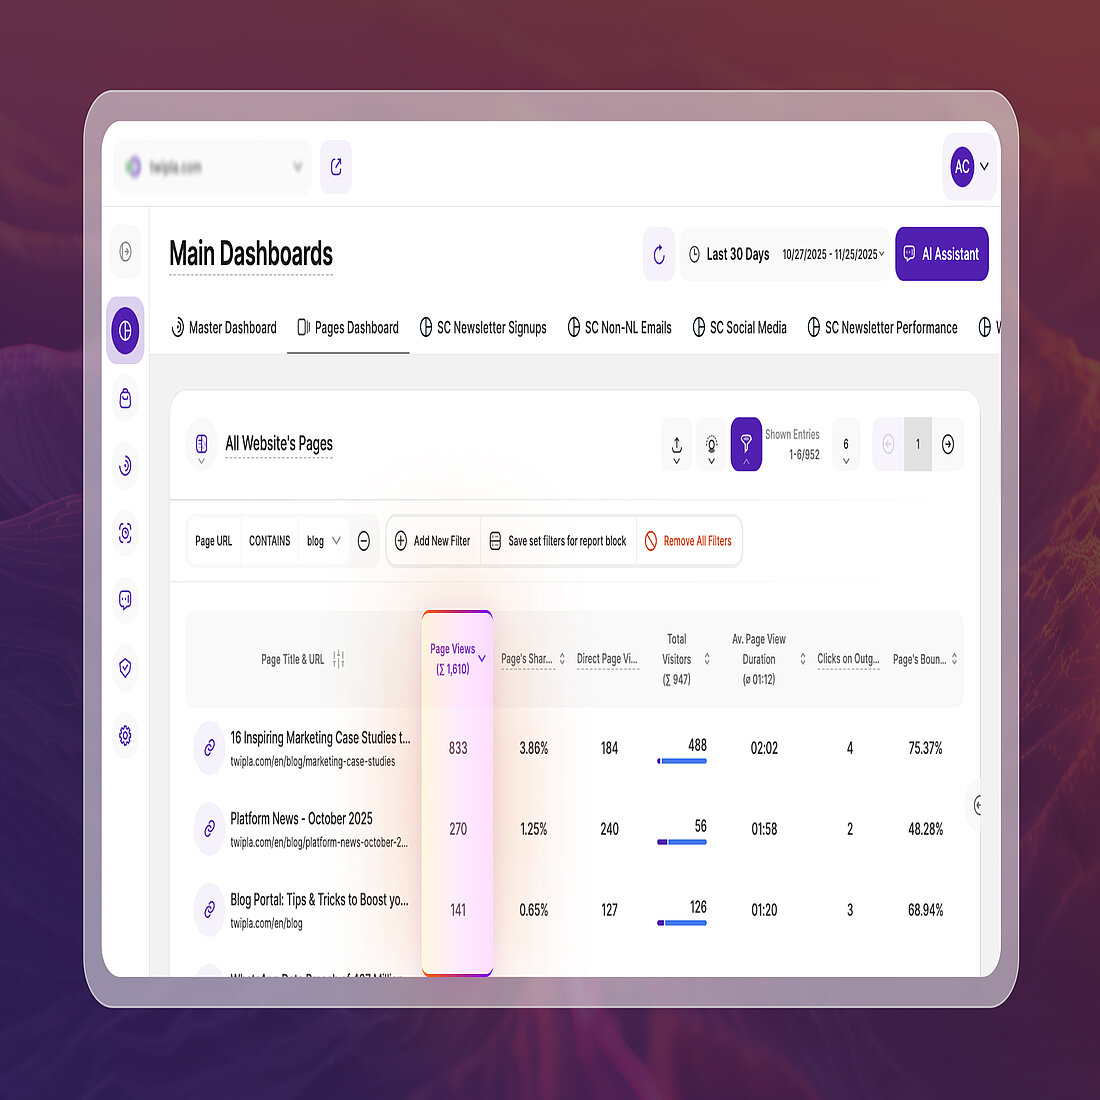
Tables across the platform now include a clear visual indicator showing which column is being used for the default sort, as well as whether the data is sorted in ascending or descending order. It’s a small detail, but one that immediately reduces confusion and makes scanning large datasets much easier.
This improvement is especially helpful when you're working with long lists of pages, visitors, or events, where understanding the active sort order affects how you interpret trends or outliers. Instead of guessing how the table is organised, you now see it instantly at a glance.
Multiple tables received this enhancement in the latest update, and the above image shows the new purple text and sort symbol in the sorted column title..
That's a Wrap for November 2025
November has been another strong month for the platform, with major feature updates, experience improvements, and a number of smaller 3AS-related fixes rolled out quietly behind the scenes to keep everything running smoothly.
We’re already gearing up for December, with more enhancements on the way and early progress on upcoming modules that we can’t wait to share with you.
If you haven’t yet, make sure you subscribe to our newsletter so you never miss an update, a feature release, or anything new happening at TWIPLA.
Share article
Get Started for Free
Gain World-Class Insights & Offer Innovative Privacy & Security


