






Competition, Industry & Regional Benchmarks
Your sector already set the standard. Here it is.
Benchmark your traffic, browsers, devices and screen sizes against the real average for your sector and region. Not modeled estimates bought from a data broker. Live data from hundreds of thousands of websites, with your own left out of the average.
OBSERVECompetition, Industry & Regional Benchmarks is one of six Observe tools. → Explore them all
REGION & SECTOR
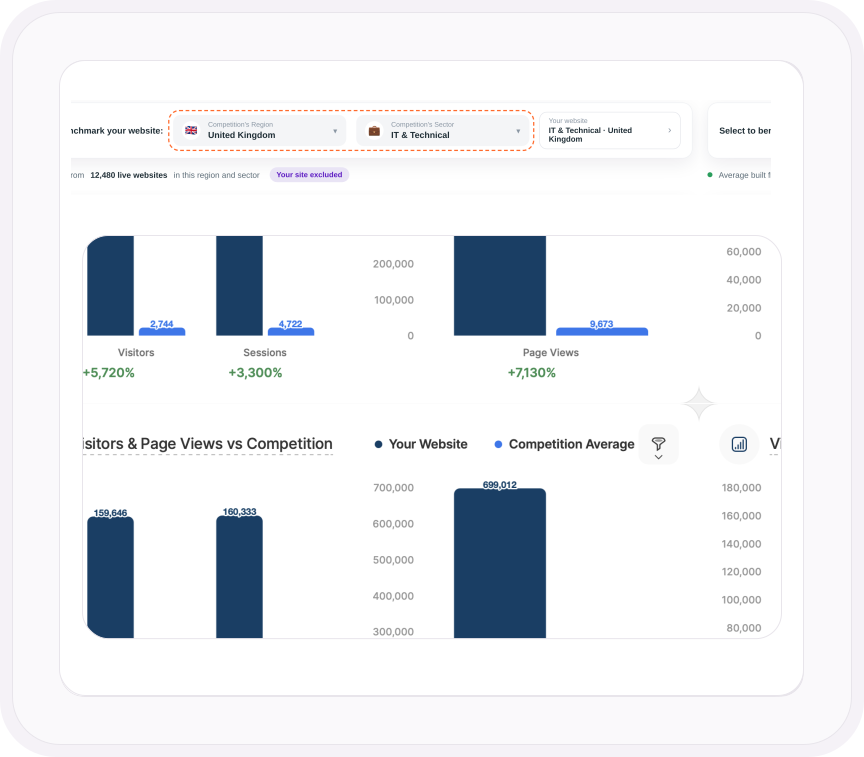
Pick who you're measured against.
Choose a region and a business sector, and the average is built from every site on the platform that matches. Your own website is excluded, so you're never quietly benchmarked against yourself. Want the wider view? Select all countries and all sectors and see where you stand against the entire platform. Change either setting and the whole comparison redraws.
- Choose any region and any business sector to define your comparison
- Averages calculated automatically from hundreds of thousands of live websites
- Your own site is excluded from the average
- Select all countries and all sectors to benchmark platform-wide
VISITORS & PAGE VIEWS
Your numbers, next to the numbers that matter.
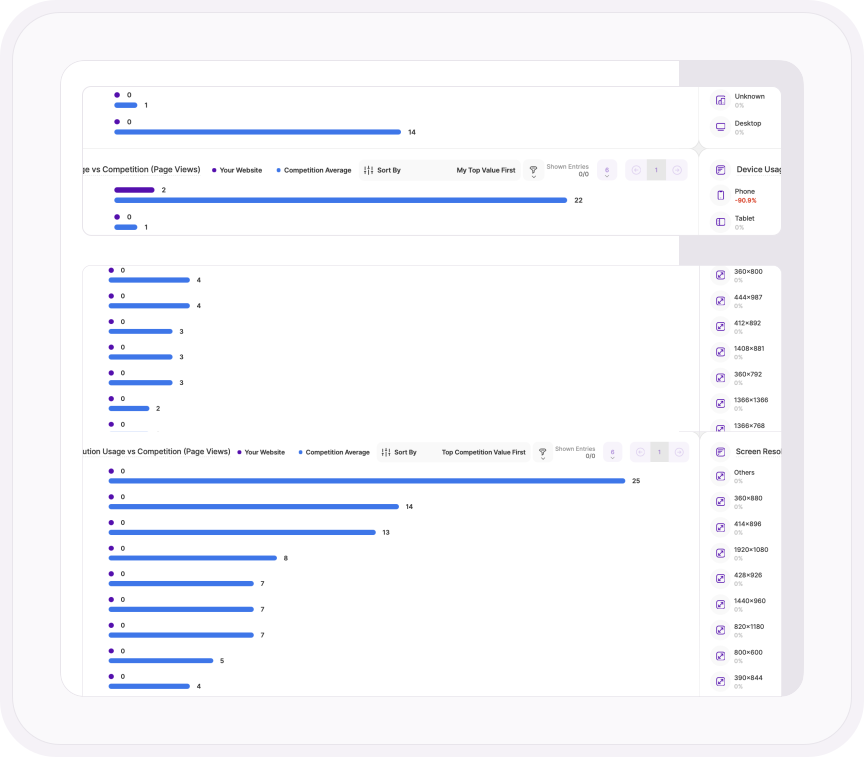
Visitors, sessions and page views, yours against the sector average, with the gap already worked out as a percentage. Six sessions on its own is just a number. Six sessions against a sector average of 77 is a conversation, and one you can walk into a meeting with.
- Visitors, sessions and page views set directly against the sector average
- The gap calculated for you as a percentage, up or down
- Any date range you like, so you can watch the gap close
TECHNICAL BENCHMARKS
Where the gap turns into a to-do list.
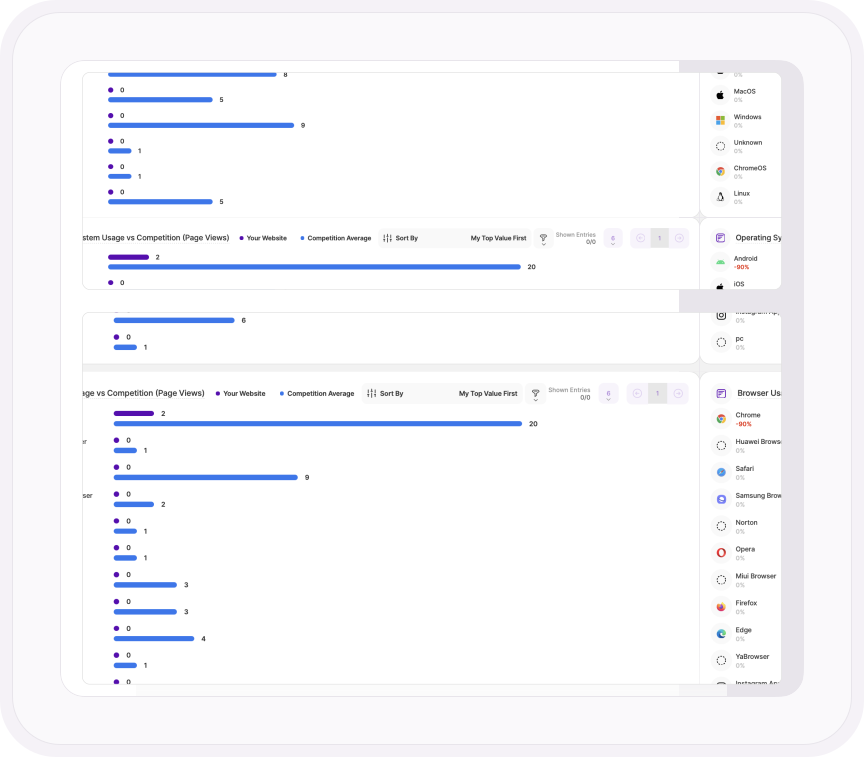
Browser, operating system, screen resolution and device type, each set against your sector. This is where benchmarking stops being interesting and starts being useful. If your sector runs at twice your share of mobile page views, you don't have a traffic problem. You have a mobile experience problem, and now you can prove it to whoever needs convincing.
- Browser usage compared page views by page views, browser by browser
- Operating systems, screen resolutions and device types, each against the sector average
- Sort by your own top values so your biggest categories come first
ONE PLATFORM, FOUR STAGES
Most analytics show you what happened. TWIPLA walks you to what to do about it.
Every tool runs on the same tracking code, and the filters you set follow you from report to report,. So a number on this page becomes a recording, a funnel or an answer in one click. Observe is where it starts. Here's the whole route.
- OBSERVE: See what's happening YOU ARE HERE
- ANALYZE: See how visitors behave →
- UNDERSTAND: See what it costs you →
- ACT: See what to do next →
More Observe tools