

Observe (Performance)
Who is my audience and what's happening across my website?
Observe is where it all starts. Every other stage of TWIPLA builds on what you see here.
Get started free, Observe includedHere’s your answer, in six tools
Live visitors, traffic sources, audiences, campaigns, benchmarks and sales, all from one setup and all filtered the same way. Start with the question that matters most to you today.
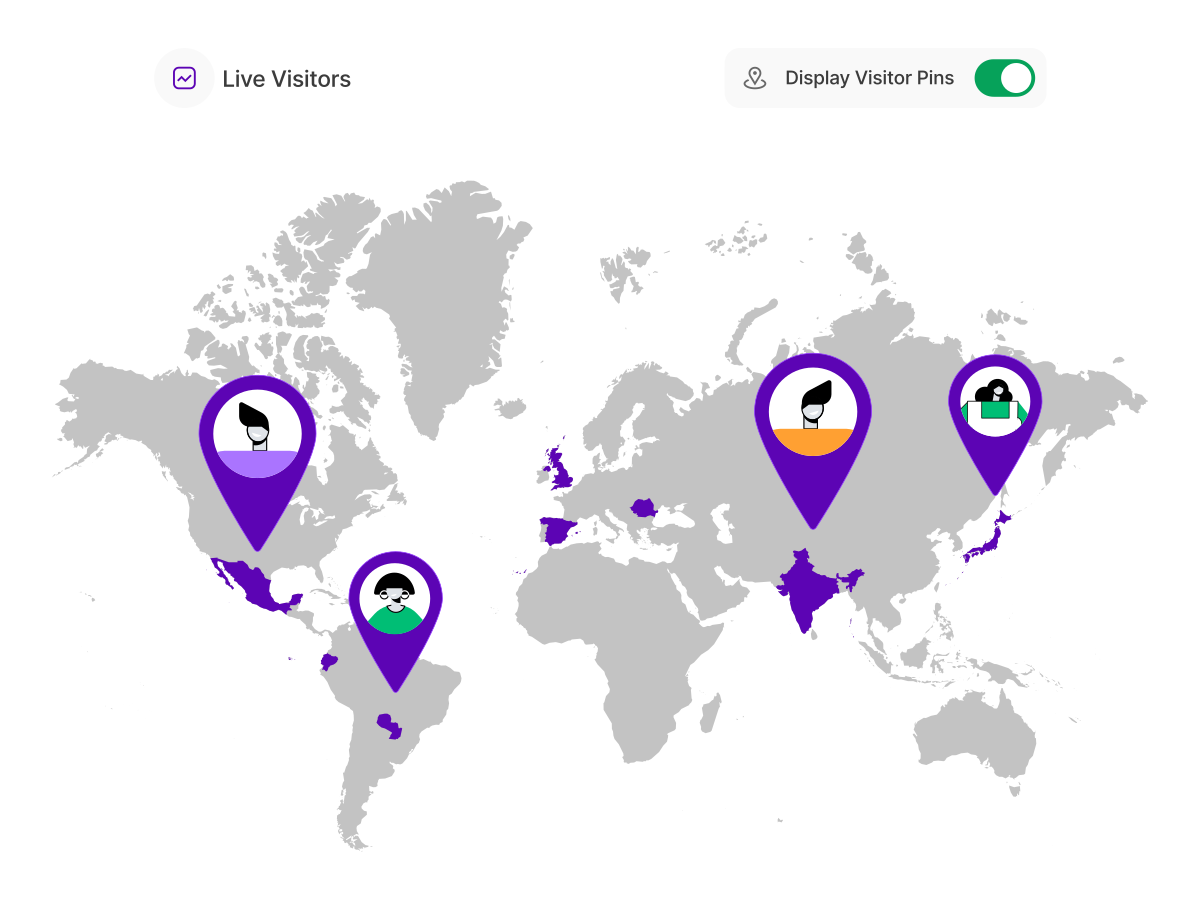
Explore Live Visitor Activity
Watch visitors arrive on a live map, see which pages they’re reading and where they came from, second by second. Filter by channel, country or device and spot an AI referral or a big customer the moment they land.
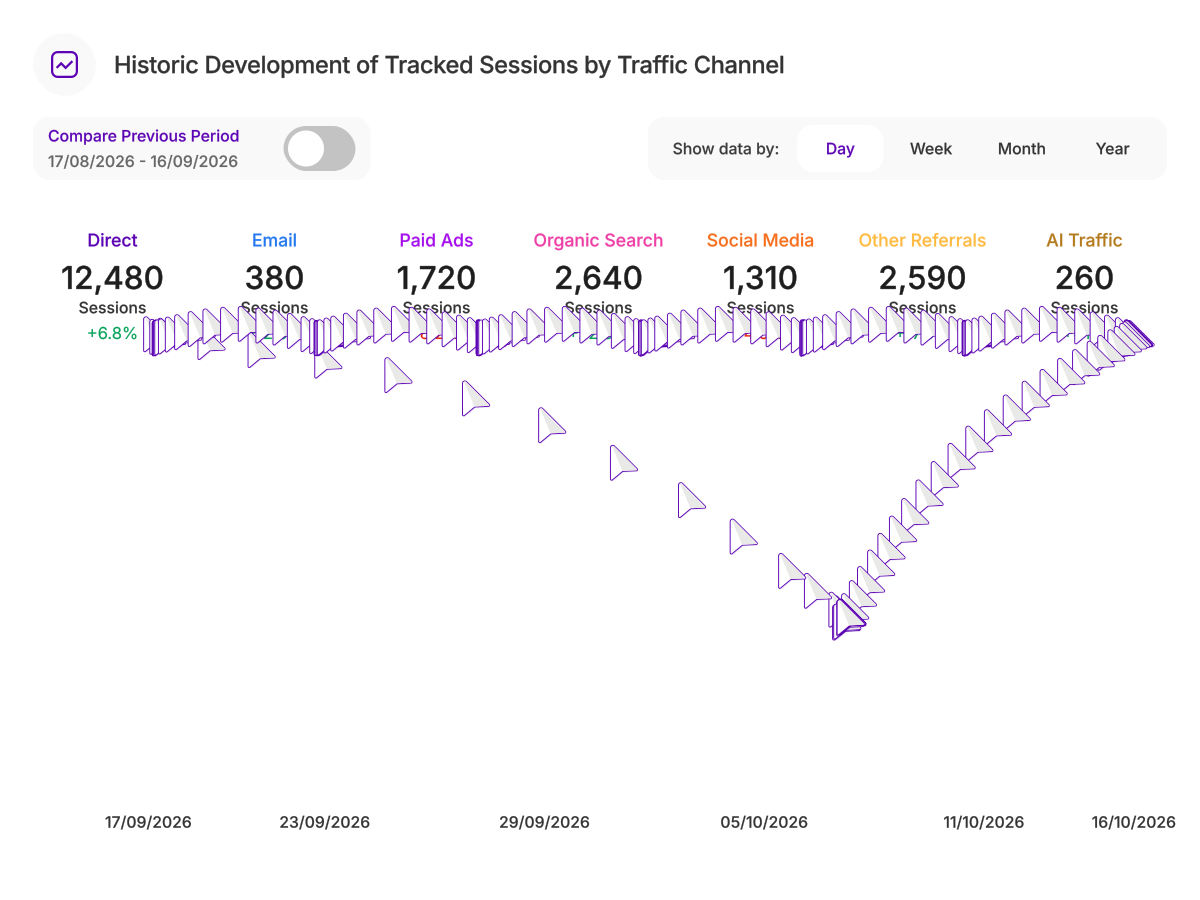
Explore Traffic Sources & Exit Paths
Every visit sorted by channel, from search and email to paid ads and AI tools like ChatGPT. Follow the trend for each one, then see which links send people away and to where. You’ll know which routes are worth more effort and which leak traffic.
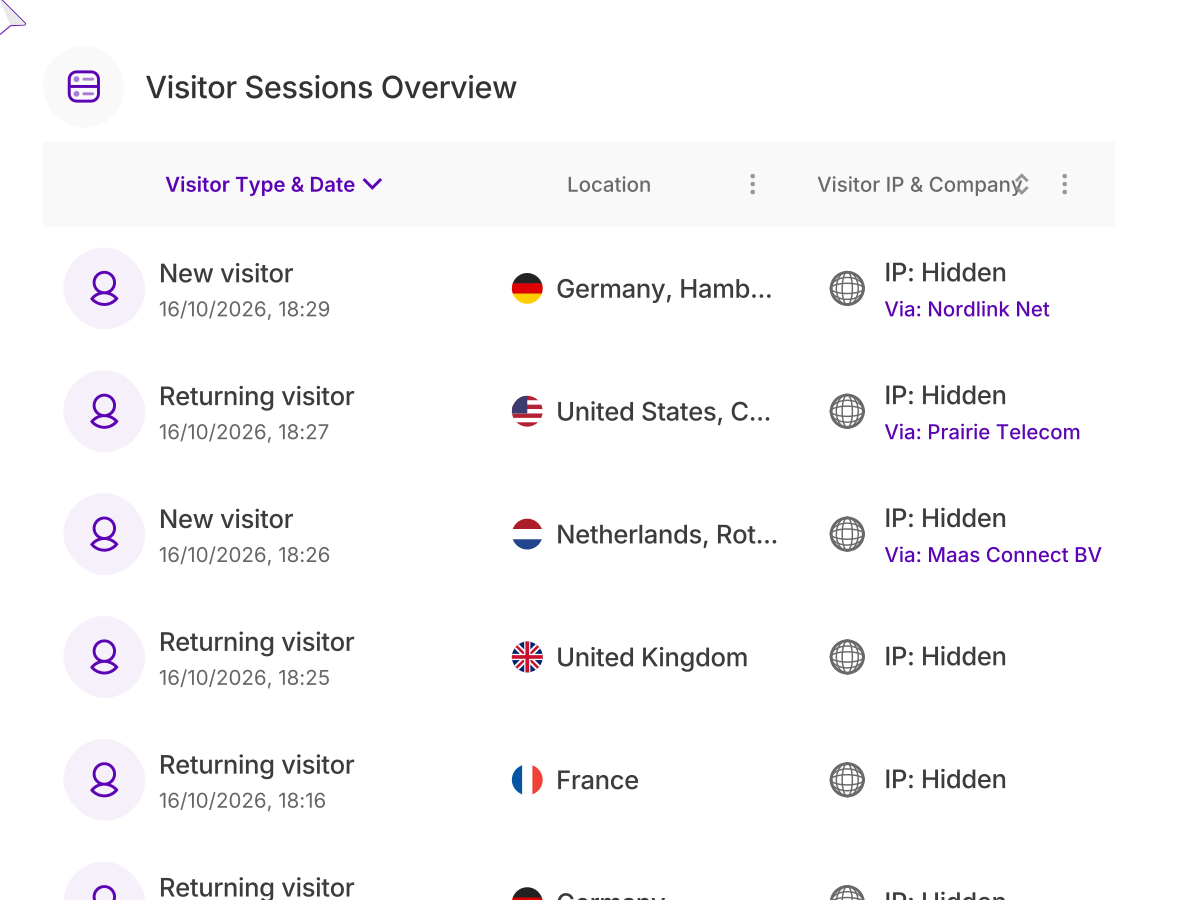
Explore Audience Intelligence
Every session with its time, location, device and pages viewed, mapped down to street level. See the hours and days your audience turns up, the businesses researching you by name, and the devices and browsers they really use. Not just how many visited, but who they were.
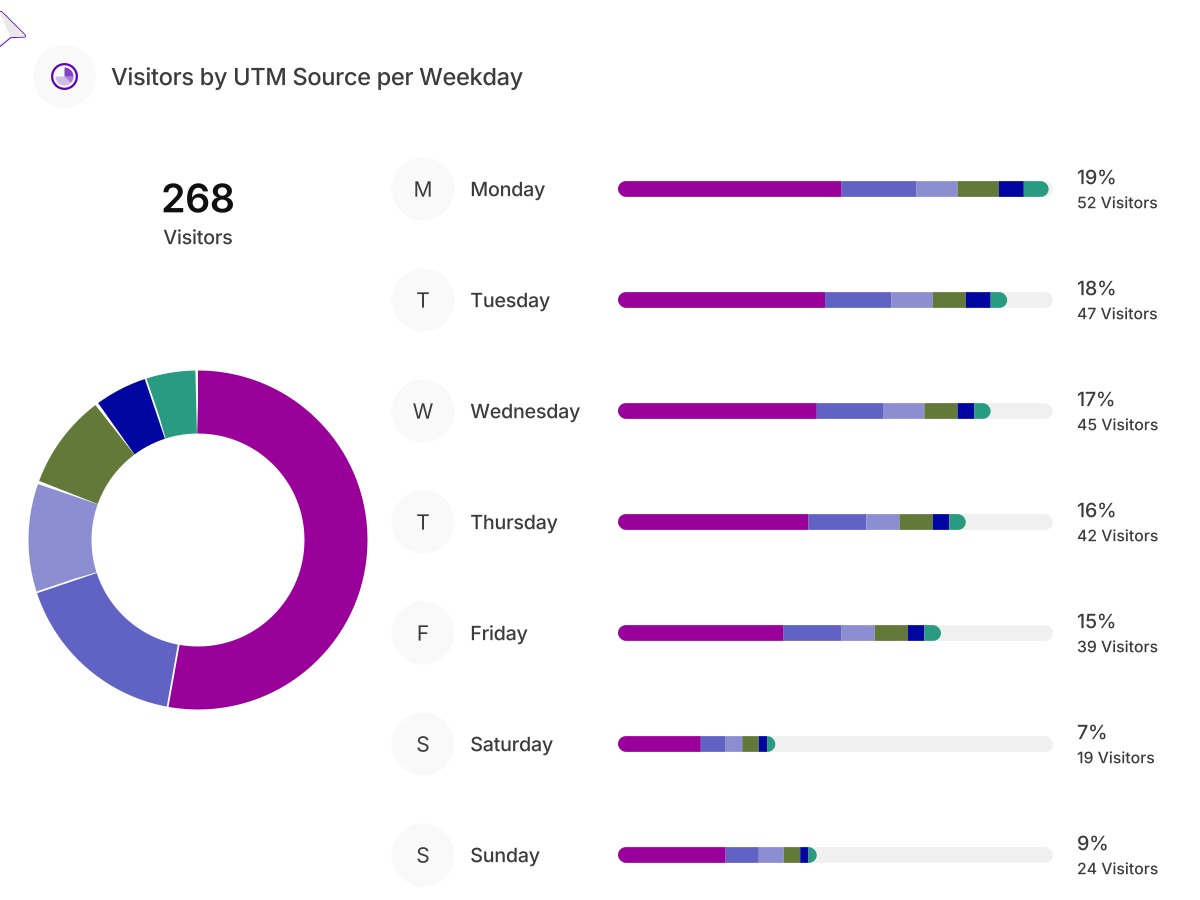
Explore Campaign Engagement
Build tracked links in seconds, then follow every campaign from the click to the last page view. Break traffic down by source, medium and creative, and see which weekday each one performs best. Back the winners and stop paying for the rest.
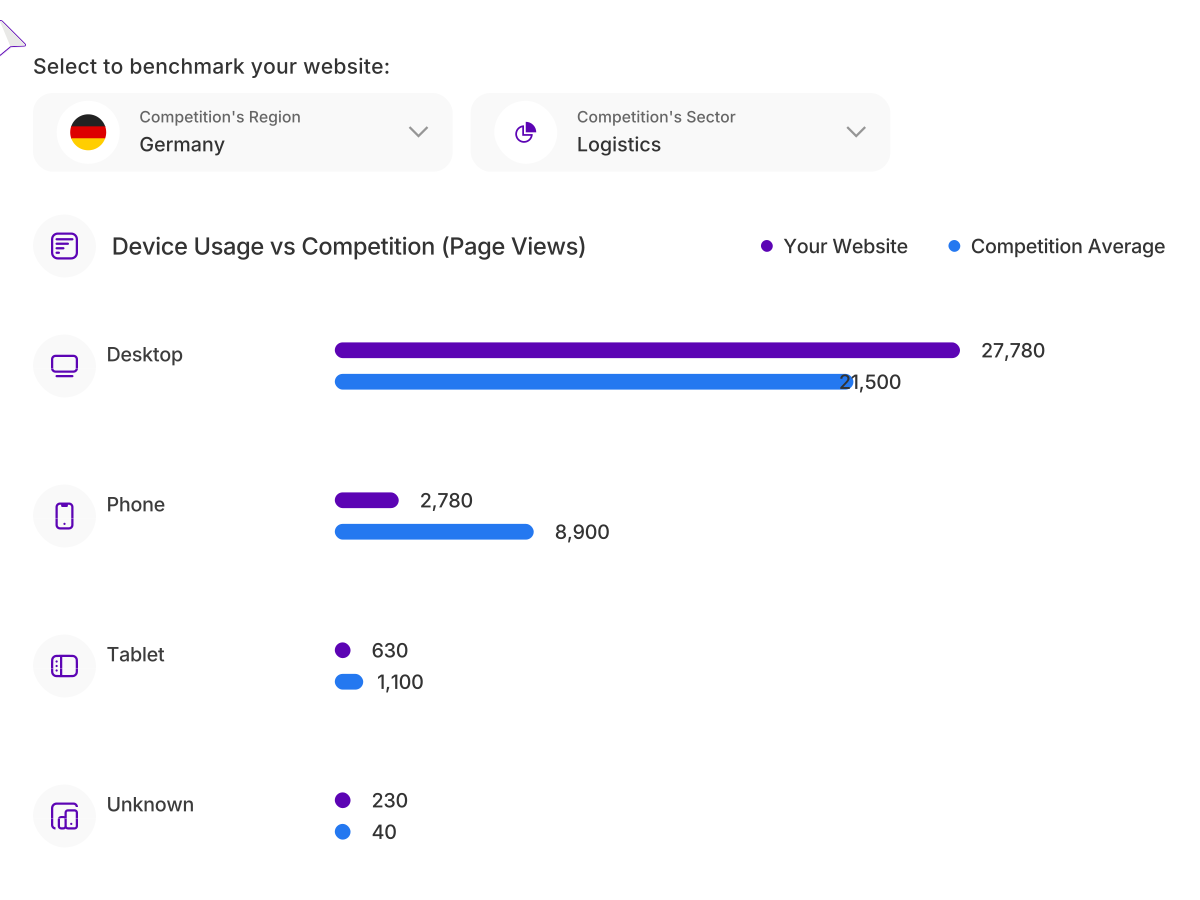
Explore Competition, Industry & Regional Benchmarks
Pick a region and an industry and put your numbers next to the real averages from hundreds of thousands of websites. See the gap on every device, browser and screen size, and know exactly where you’re ahead and where you’re losing visitors.
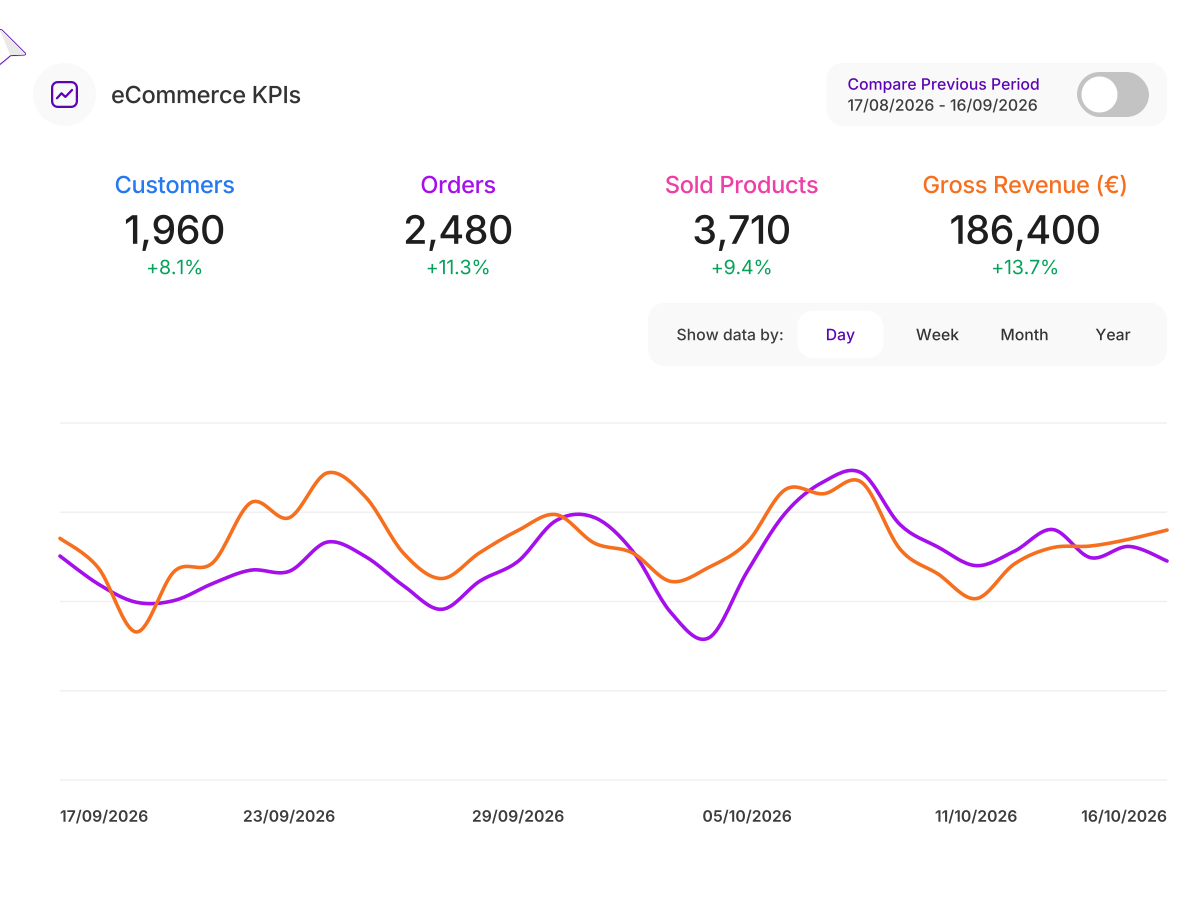
Explore eCommerce Analytics
Revenue, orders, refunds and average order value, tied to the channel, campaign and company that brought each sale. See where shoppers add to cart but never pay, and fix the gap that costs you the most.
ONE PLATFORM, FOUR STAGES
Most analytics show you what happened. TWIPLA shows you what to do about it.
Every tool runs on one setup, and the filters you set follow you from report to report. So a number on this page becomes a recording, a funnel or an answer in one click. Observe is where it starts. Here's the whole route.
- OBSERVE: See what's happening
- ANALYZE: See how visitors behave
- UNDERSTAND: See what it costs you
- ACT: See what to do next

Learn more
See more of your audience, and share what you find
Count the visitors your banner loses
With no cookie banner to click, every visitor is counted, up to five times the data.
Explore Maximum Privacy ModeVirgin Atlantic sees four times more traffic
Every booking step tracked across all its domains, from routes and seats to failed checkouts.
Read the Virgin Atlantic storyTurn your dashboard into the monthly report
Use cases from year-on-year reviews to seasonal trends and traffic anomalies.
Read the guideShare the numbers, not the login
Give a client or your boss a view-only dashboard of exactly what they need.
See how dashboard sharing worksRunning Matomo?
All the analytics power, with no plugins to install, update or pay for.
Compare the twoWhich channels actually earn their budget?
How marketing teams use TWIPLA to settle the argument the ad dashboards start.
See it for marketing teamsTalk to a human
Bring the question you can’t answer today
Tell us about your website and what you need to know. A member of our team will reply by email and show you exactly where TWIPLA finds the answer.
Thanks, we have your message
A member of our Sales team will reply to your email soon.
