Content Analysis
See what your readers actually read. Down to the block.
Content Analysis shows you which authors, tags, categories and content blocks bring in readers, hold their attention and turn them into conversions. Stop guessing what to commission next and read the scoreboard instead. Already live on WP Engine, and one call away on any other site.
AUTHORS
Rank your writers by what their readers actually do.
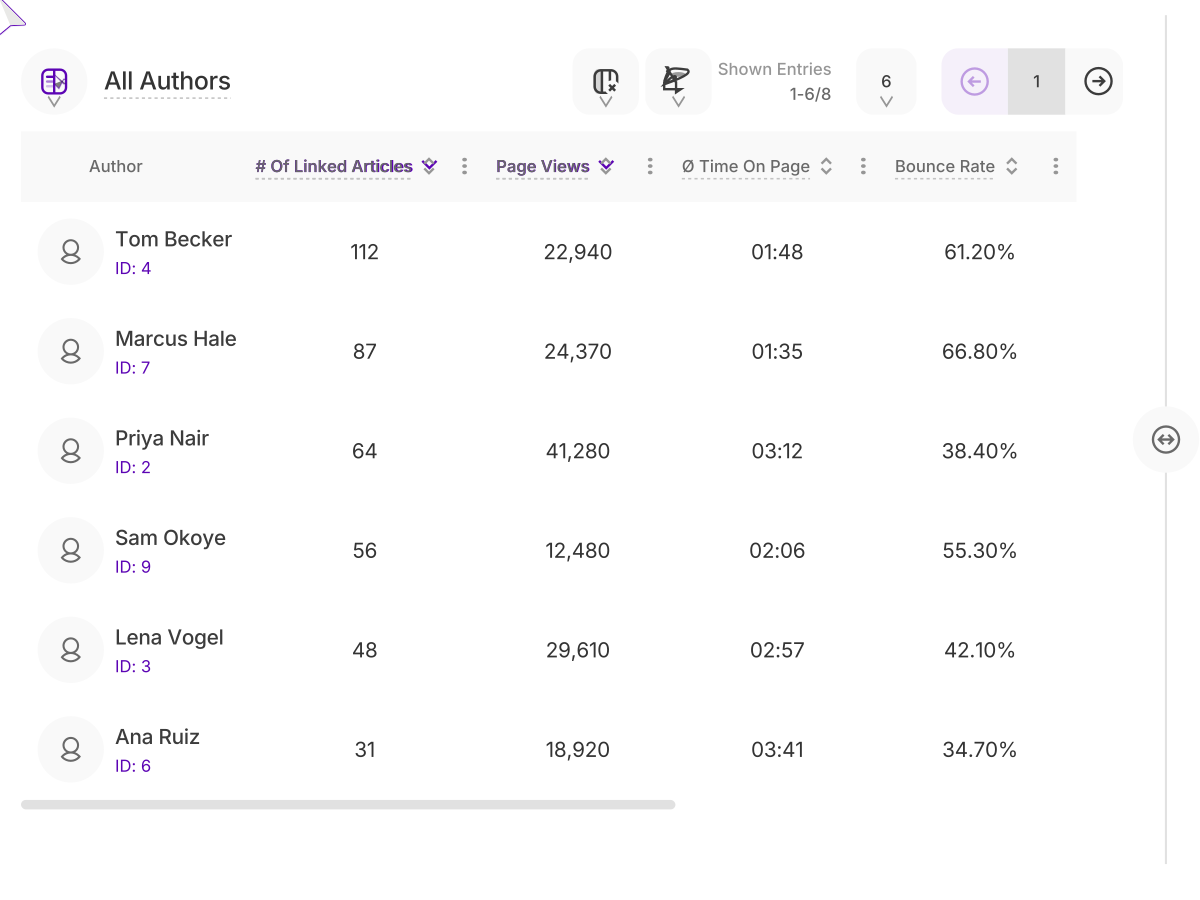
Open the Authors tab and every writer on your site sits in one table, ranked by whichever column you click.
The picture is immediate. The author with the most articles is rarely the one bringing the most readers, and the writer with modest traffic can be the one whose pieces convert.
- Nine metrics per author, from page views and time on page to scroll depth and conversion events
- Every number is an aggregate across all of that author’s articles in the date range you choose
- Advanced bounce rate only counts a visit as a bounce if the reader didn’t stay, click or convert
- Select an author to chart them over time by day, week, month or year, or compare multiple contributors
TAGS AND CATEGORIES
See which topics earn attention and which ones just earn clicks.
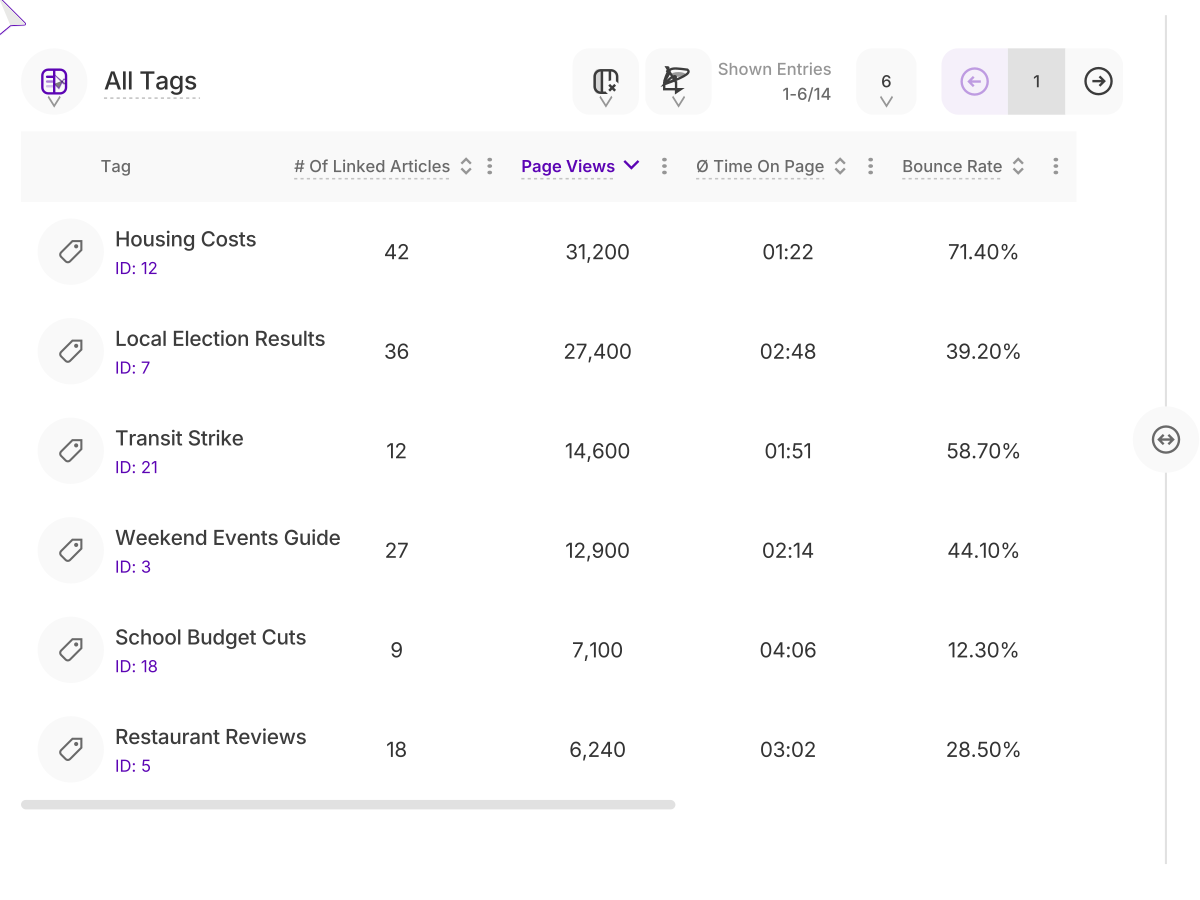
Tags and categories get their own tabs, with the same table and the same metrics.
That’s where decisions change. A category with strong traffic and a high bounce rate is a headline promise the content isn’t keeping. A tag with low traffic and zero bounces is an audience you haven’t fed enough.
- An article with three tags counts toward all three, so overlapping topics are measured fairly
- Select several tags or categories to compare them on one graph
- Filter any tab by traffic channel, UTM campaign, country or device to see which writers and topics win each audience
BLOCKS
Go deeper than the page. See which kinds of content hold readers.
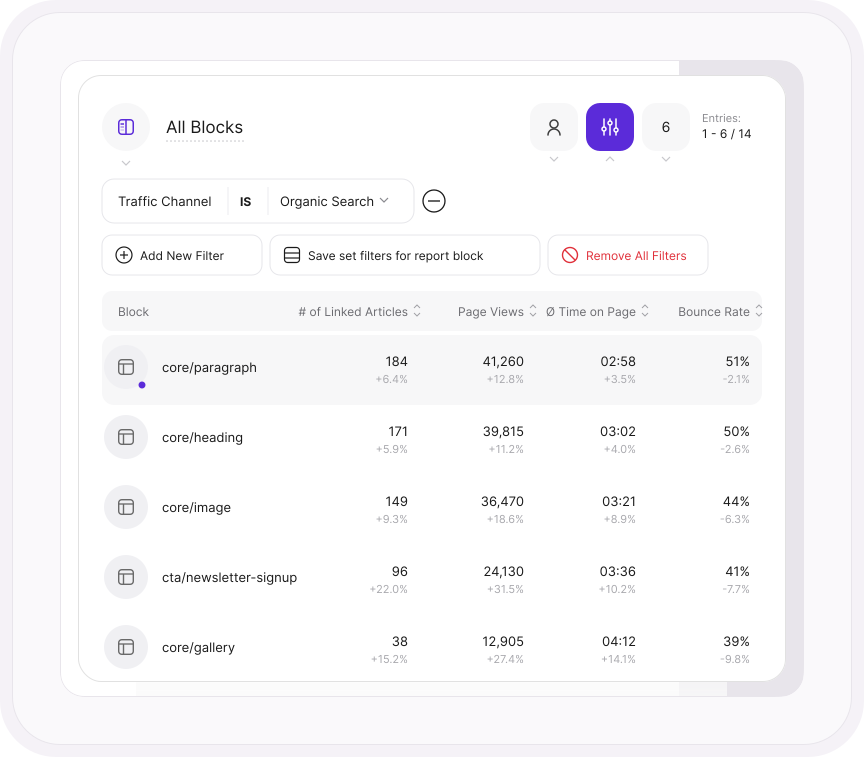
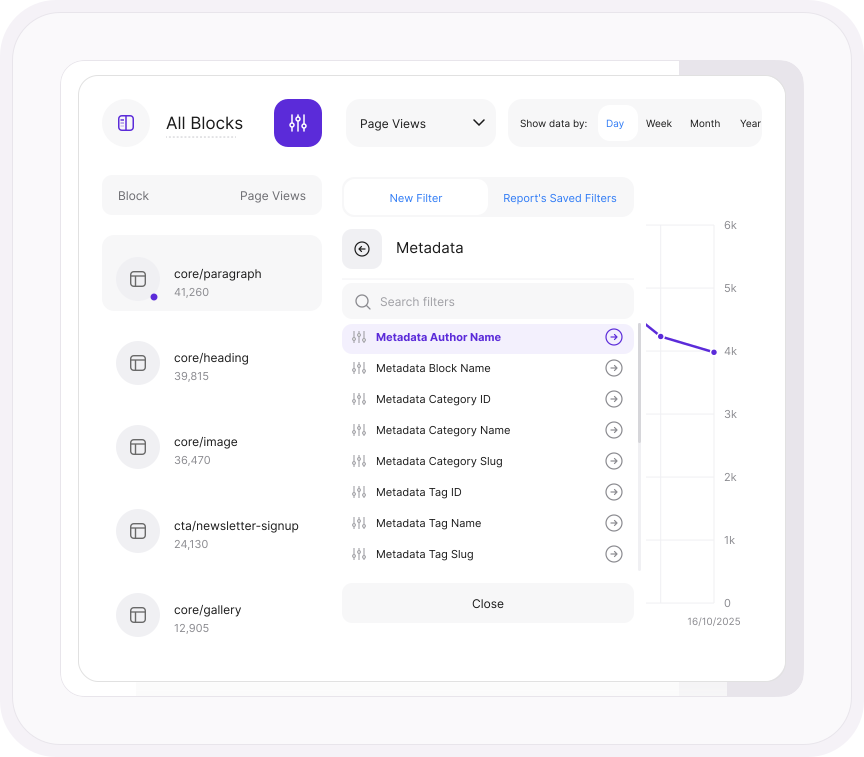
Pages are made of parts: headings, images, paragraphs, galleries, embeds. The Blocks tab shows how the pages using each block type perform, across your whole site.
So you can finally answer the questions page-level analytics can’t. Do image-heavy pieces hold readers longer? Do pages with a gallery convert better?
- Filter by page URL to see the blocks on a single page and how that page performs
- Block names come straight from your CMS, so WordPress blocks appear exactly as the editor names them
SETUP
One block of code. Or none at all.
On WP Engine, it's already running. Your site tells TWIPLA who wrote each page and how it's tagged, and there's nothing for you to add.
On any other website, book a call with Dragos and we'll switch it on for your account. Your CMS then passes the same details through one small block of metadata in the page source.
- Data starts flowing from the first visit once it's switched on
- Runs in every privacy mode, including Maximum Privacy
- Author, tag and category become filters on your main dashboards
ONE PLATFORM, FOUR STAGES
Most analytics show you what happened. TWIPLA shows you what to do about it.
Every tool runs on one setup, and the filters you set follow you from report to report. So a number on this page becomes a recording, a funnel or an answer in one click. Understand shows what your content and your traffic actually deliver. Here's the whole route:
- OBSERVE: See what's happening
- ANALYZE: See how visitors behave
- UNDERSTAND: See what it costs you - YOU ARE HERE
- ACT: See what to do next

Learn more
From what they read to what you publish next
Turn your best topics into your next articles
Growth Engine ranks what to write next from the same reader data, then drafts it.
Explore Growth EngineSee how far readers really scroll
Scroll and click maps for any article, so you know where attention runs out.
Explore HeatmapsPaying for Chartbeat?
Author and topic performance, plus heatmaps, funnels and recordings, for far less.
Compare the twoWhy live numbers alone don't help editors
What newsrooms need beyond a real-time dashboard to decide what to publish.
Read the postMore in Understand
You know what they read.
Now see what it earned you.