






Conversion & Revenue Tracking
See the exact moment the journey breaks, and what it's worth to fix it.
Conversion & Revenue Tracking lets you define what counts as a conversion, attach a value to it, and map the path visitors take to get there. Then it shows you where they drop out, plays you the recording, and tells you which channel, campaign or country is actually paying.
UNDERSTANDConversion & Revenue Tracking is our first Understand tool, with more coming soon. → Explore all features
Define it. Map it. Price it.

Conversion Events
Decide what counts as a win on your site, and what each one is worth.


Conversion Funnels
Map any route through your site, up to fourteen steps, and see exactly where visitors leave.

Revenue by Source
Conversion value by campaign, channel, referrer, device and country.
CONVERSION EVENTS
A conversion is whatever you say it is.
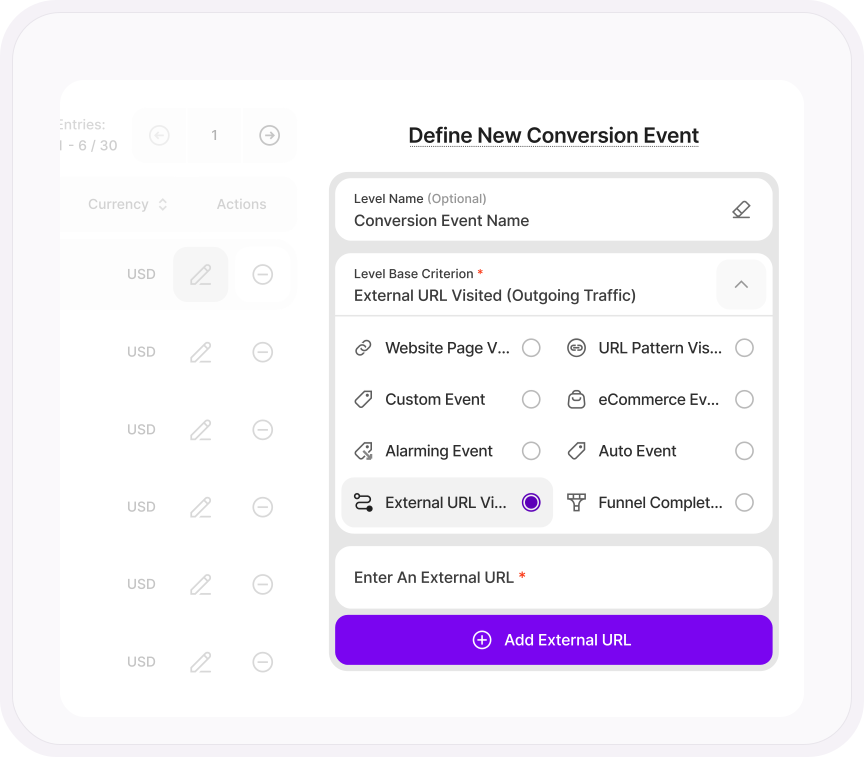
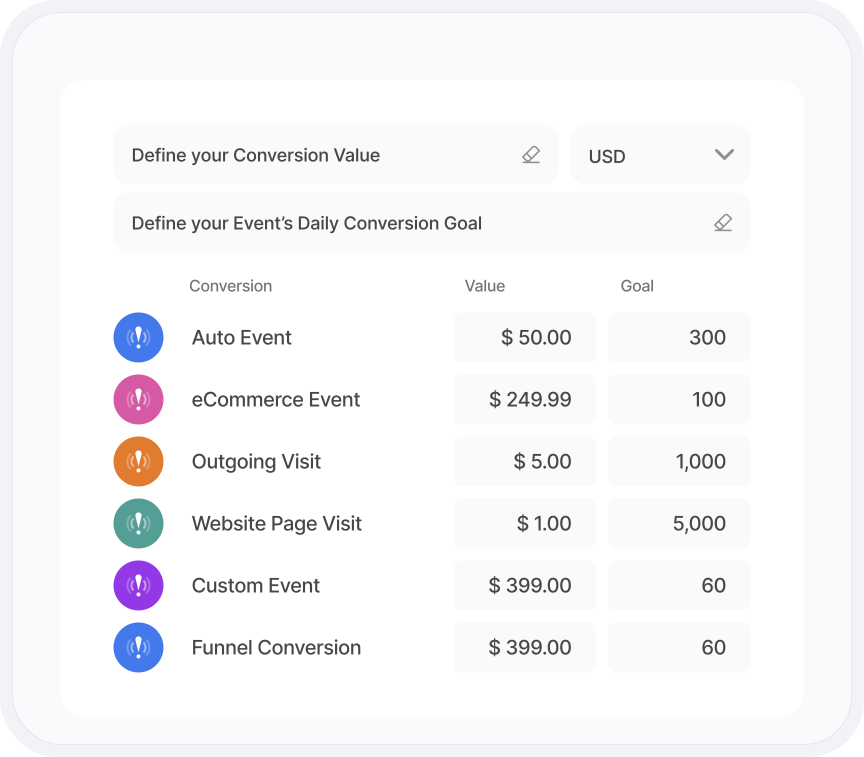
A purchase, a demo booked, a PDF downloaded, a form sent, a click through to your app store listing. If it matters to your business, make it a conversion event and give it a value in your currency. From then on every report on the platform can tell you not just that it happened, but what it was worth.
- Define a conversion from a page visit, a URL pattern, a custom event, an automatically tracked click, an eCommerce event, an outgoing link, or even a frustration signal like a rage click
- Attach a value and a currency to every event, so a lead is worth something even when it isn't a sale, and a rage click on the checkout can carry a cost
- Set a daily goal per event and see how far off you are
- Conversion rate, converted sessions and total value tracked over time, with a previous-period comparison
Build the funnel today. See last month's dropoff now.
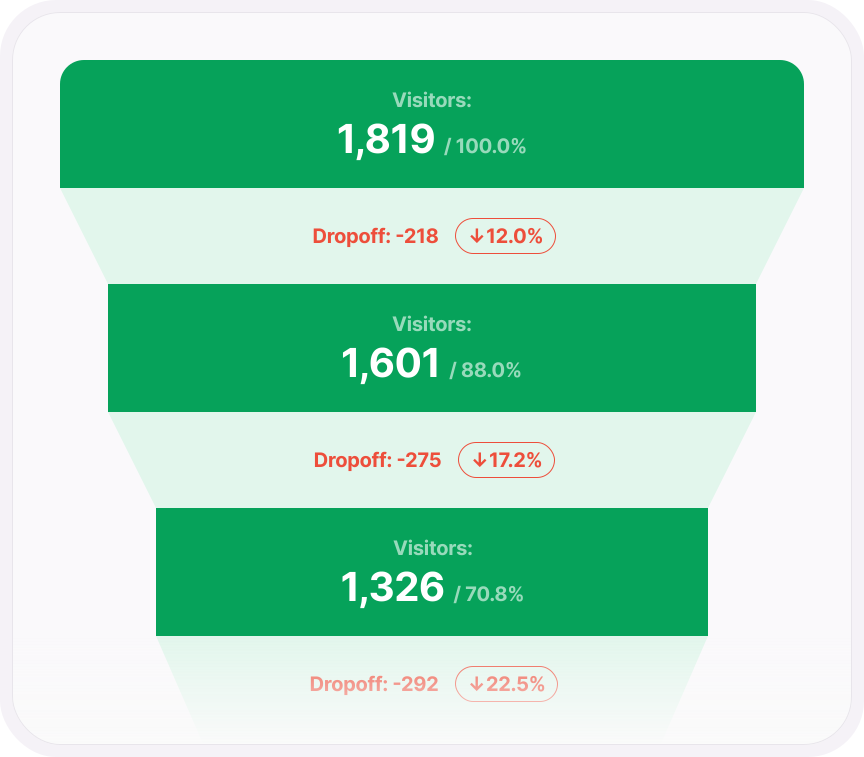
Most funnel tools start counting the day you create the funnel. This one calculates from the data you already have, so a funnel you build this afternoon shows you where visitors have been leaving all along. Up to fourteen steps, in the order you set, and a step can be anything: a page, a URL pattern, a button click, an add to cart, a rage click, or a click out to a competitor.
- Historic data shown the moment a funnel is created, no waiting for it to fill
- Two to fourteen levels, with seven kinds of step to choose from
- Sessions, conversions and dropouts at every level, plus an expected conversion rate you set so you can see the gap
- Cross-domain funnels for journeys that span more than one site
WATCH DROPOUTS
Find the step they left at. Then watch them leave.
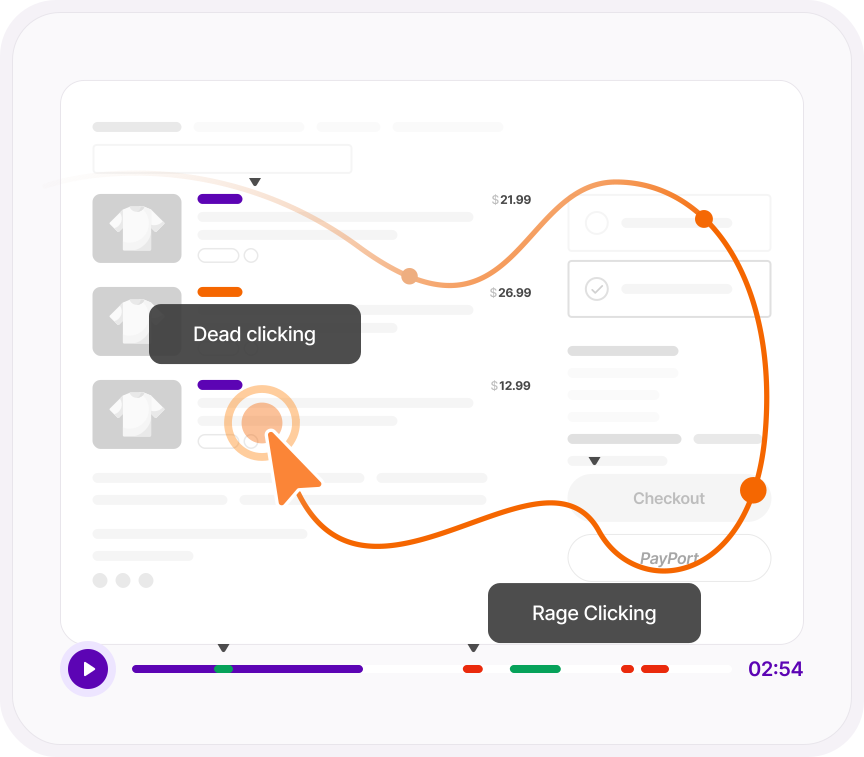
Every funnel level has a Watch Dropouts button. Click it and you're looking at the session recordings of the people who got that far and no further. Not a number on a chart, the actual visits, with heatmaps of the page a click away. And because every filter in the platform works here, you can narrow the dropouts to one campaign, one device, one country or one company before you press play.
- Session recordings of the visitors who dropped out at any level
- Heatmaps of the pages in the funnel from the same view
- Filter funnel sessions by traffic channel, campaign, referrer, device, country, city or company
REVENUE BY SOURCE
Which campaign paid for itself. In your currency.
Once a conversion has a value, the Conversions module does the arithmetic across everything that sent traffic. Total conversion value and conversion rate by UTM campaign, referrer, traffic channel, device, browser, screen resolution, country and city. That's the difference between "the paid campaign got 4,000 clicks" and "the paid campaign made 1,200 in demo bookings, and the newsletter made 4,800."
- Converted sessions, conversion triggers, conversion rate and total conversion value for every segment
- Broken down by campaign, referrer, channel, device, browser, resolution, country and city
- Choose which conversion events count in any report, and compare against the previous period or last year
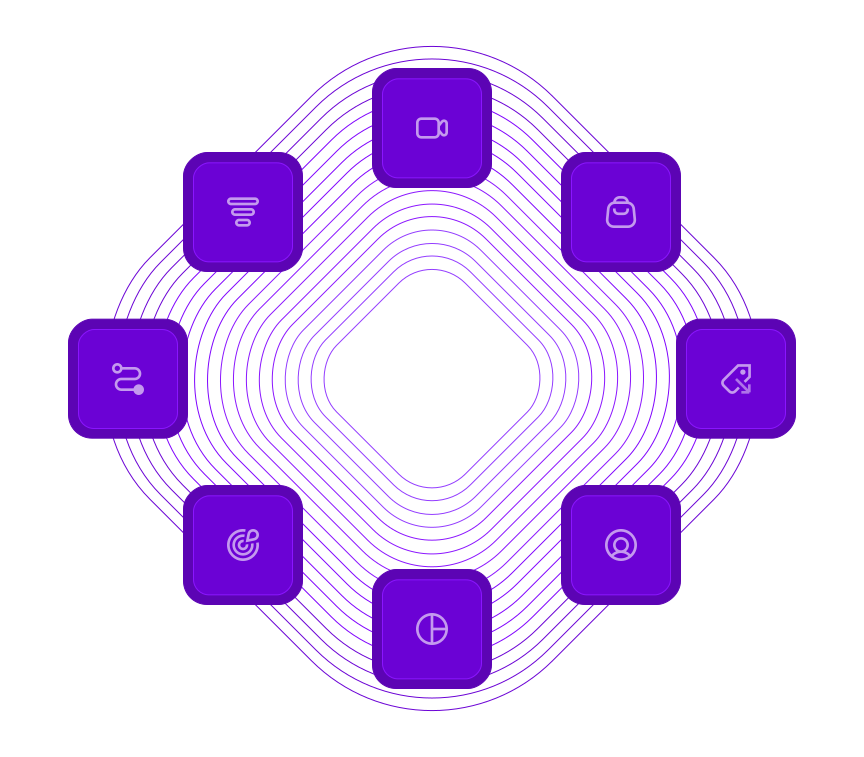
ONE PLATFORM, FOUR STAGES
Most analytics show you what happened. TWIPLA walks you to what to do about it.
Every tool runs on the same tracking code, and the filters you set follow you from report to report. So a number on this page becomes a recording, a funnel or an answer in one click. Understand is where behavior gets a price tag. Here's the whole route.
- OBSERVE: See what's happening →
- ANALYZE: See how visitors behave →
- UNDERSTAND: See what it costs you YOU ARE HERE
- ACT: See what to do next →
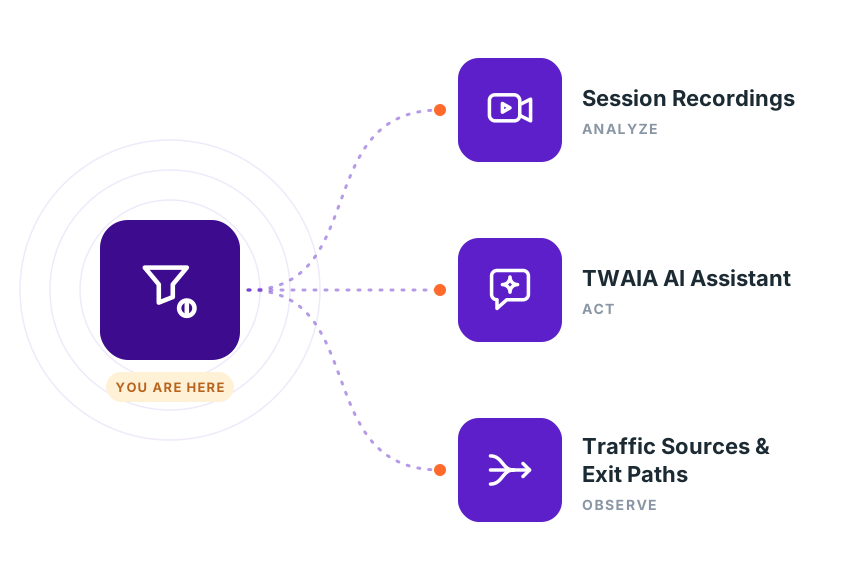
WHERE TO GO FROM HERE
You know what the leak is worth.
Next, watch it, ask what to do, and find out who's leaking.
- Session Recordings: Watch Dropouts from any funnel step, one click
- TWAIA AI Assistant: Ask why the funnel leaks and get the answer with the chart
- Traffic Sources & Exit Paths: Which channels send the visitors who convert, and which don't
